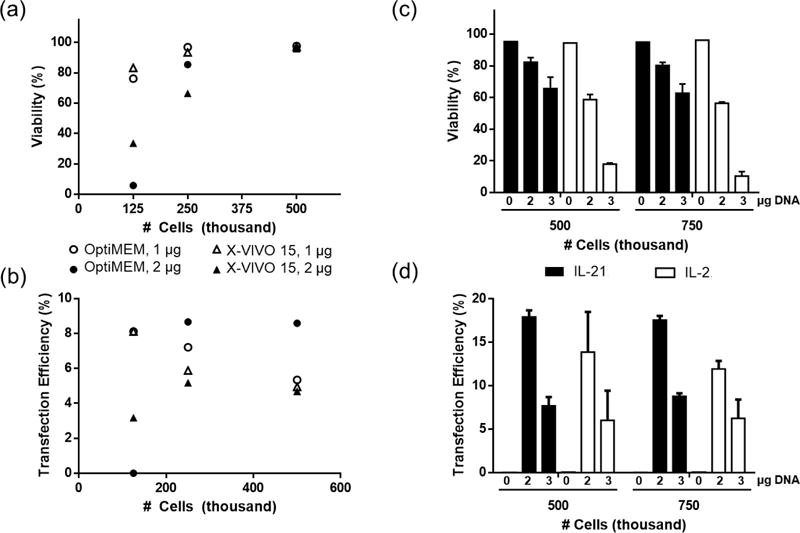
Figure 4.

Design of Experiments (DOE) optimization of primary T cell transfection conditions. (a & b) Screening effects of transfection medium, cell density, and DNA dose on viability and transfection efficiency (n=1). (c & d) Screening effects of cytokine supplement in culture medium, cell density, and DNA dose (n=3). Cells were transfected with pmaxGFP pDNA at N/P ratio of 7 using CP-25-16. Transfection efficiencies are expressed as percentage of GFP-positive cells. Data are shown as mean ± SD.
