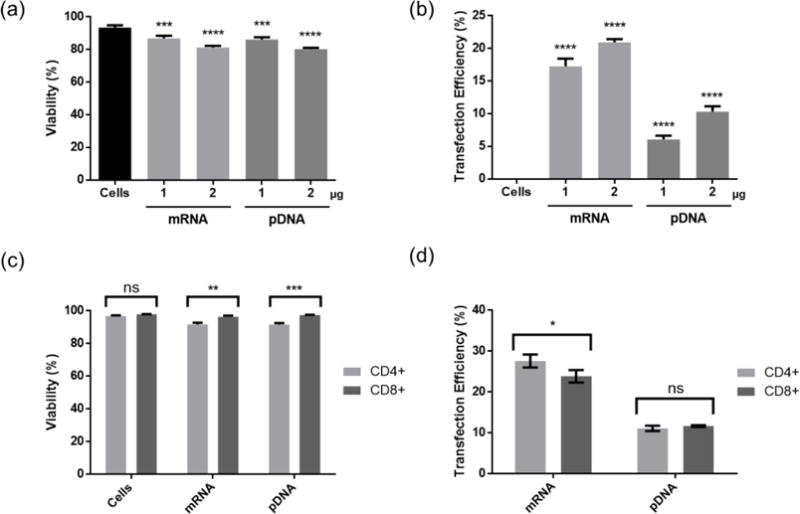
Figure 5.

Viability (a) and transfection efficiency (b) of eGFP expressing pDNA and mRNA to a mixture of CD4+ and CD8+ T cells at optimized conditions. Viability (c) and transfection efficiency (d) in CD4+ and CD8+ T cells. Cells were transfected with pDNA at N/P ratio of 7 using CP-25-16. Transfection efficiencies are expressed as percentage of GFP-positive cells. Data are shown as mean ± SD (n =3; (a & b) 1-way ANOVA with Tukey’s multiple comparisons, (c & d) multiple t tests, *p<0.05, * *p<0.01, ***p<0.001, ****p<0.0001).
