
Figure 1.
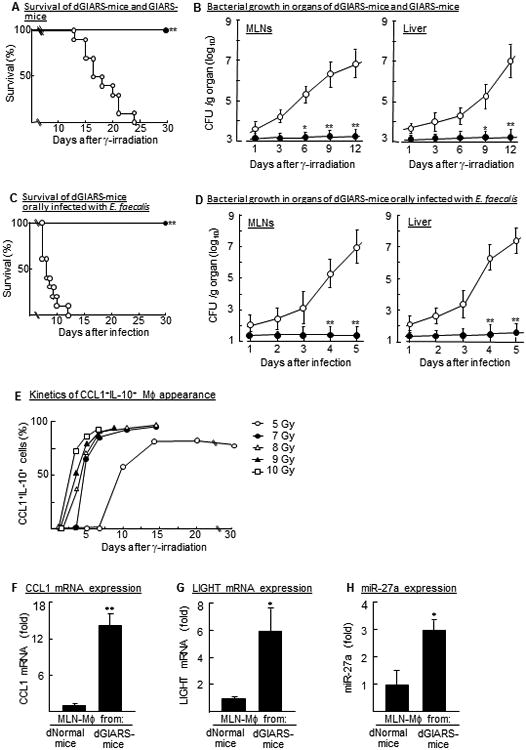
Sepsis and Pheno2b-Mφ demonstrated in 7 Gy GIARS-mice with or without antibiotic decontamination. (A) Mortality rates of 7 Gy GIARS-mice with (dGIARS-mice, ●) or without (GIARS-mice, ○) an antibiotic decontamination. **p <0.001 (log-rank test). (B) Bacterial growth in the MLNs and liver of dGIARS-mice (●) and GIARS-mice (○) 1 to 12 days post-irradiation. Data are displayed by the mean ± SE. *p <0.01, **p <0.001 (Student's t test). (C) Mortality rates of dGIARS-mice orally infected with (▼) or without (ɟ) E. faecalis. Seven days after γ-irradiation, dGIARS-mice were orally infected with 105 CFU/mouse of E. faecalis. **p <0.001 (log-rank test). (D) Bacterial growth in organs of dGIARS-mice infected with (○) or without (●) E. faecalis. Data are displayed by the mean ± SE. *p <0.01, **p <0.001 (Student's t test). (E) Appearance of Pheno2b-Mφ in the MLNs of 5 Gy WBI-mice and 7-10 Gy GIARS-mice. MLN-Mφ, isolated from various groups of mice 1 to 30 days post-irradiation, were analyzed for CCL1+IL-10+ cells by flow cytometry. (F-H) MLN-Mφ, isolated from dNormal mice and 7 Gy dGIARS-mice 7 days post-irradiation were analyzed for the expression of typical Pheno2b-Mφ biomarkers by real-time PCR; CCL1 mRNA (F), LIGHT mRNA (G), and miR-27a (H). Data are displayed as mean ± SE from three independent experiments. *p <0.01, **p <0.001 versus dNormal mouse MLN-Mφ (Student's t test). Data are representative of two (A-D) or three (E-H) independent experiments. Three (E-H), four to five (B, D), or ten (A, C) mice per group were used in each independent experiment.