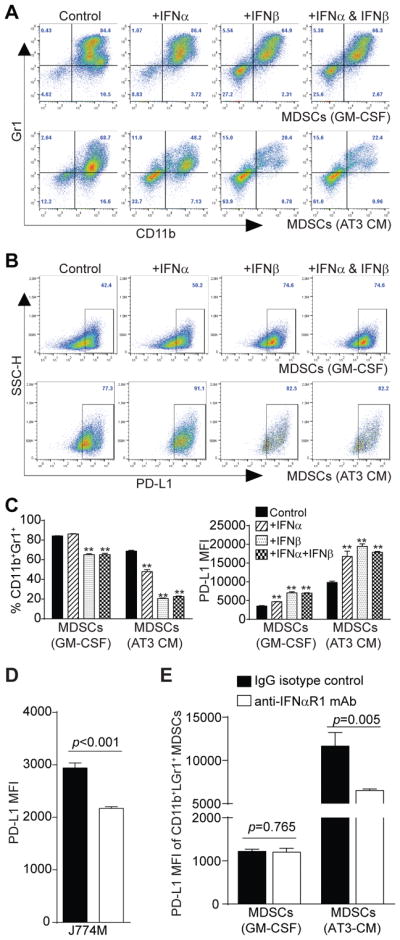
Figure 7. Type I interferon regulates PD-L1 expression in MDSCs by an autocrine manner.

A. BM cells were cultured in the presence of GM-CSF (top panel) or AT3 tumor cell-conditioned medium (bottom panel). Recombinant IFNα (20 ng/ml), recombinant IFNβ (20 ng/ml) or both IFNα and IFNβ were added to the cultures. Four days later, cells were stained with CD11b-, Gr1-, and PD-L1-specific mAbs and analyzed by flow cytometry. Shown are representative plots of CD11b+Gr1+ cells of one of two experiments. B. The CD11b+Gr1+ cells as shown in A were gated and plotted for PD-L1 expression levels. C. CD11b+Gr1+ cells as shown in A were quantified and presented at the left. MFIs of PD-L1on MDSCs from different treatment groups as gated in B were also quantified and presented at the right. Column: mean; Bar: SD. D. J774M cells were cultured in the presence of IgG isotype control or IFNβ (10 μg/ml) neutralizing mAb for 4 days and analyzed for PD-L1 expression level. Column: mean, Bar: SD. E. BM cells were cultured in GM-CSF or AT3 tumor cell-conditioned medium in the presence of IgG isotype control mAb or anti-IFNAR1 neutralizing mAb (50 μg/ml) for 4 days. CD11b+Gr1+ cells were then gated and quantified for PD-L1 MFI. Column: mean, Bar: SD. Shown are representative results of one of two independent experiments.
