Fig. 5.
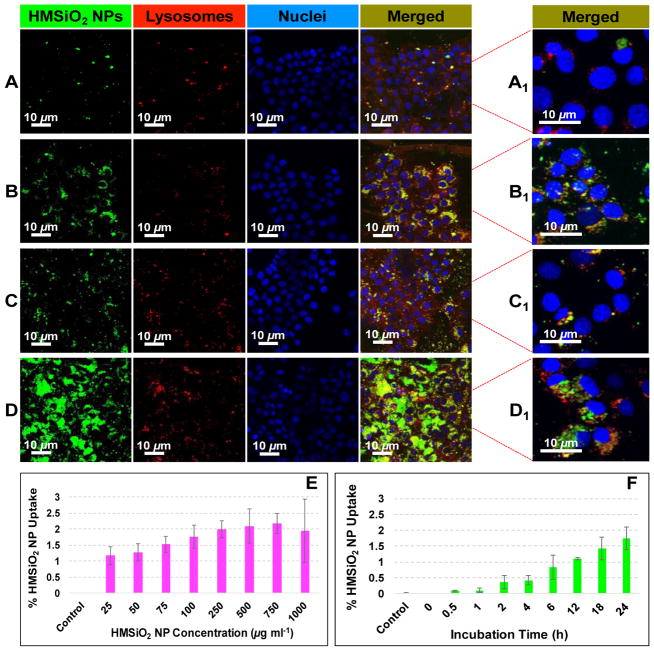
Intracellular trafficking of GSH-sensitive HMSiO2 NPs in MCF-7 cells: (A–D) Representative CLSM images of the cells treated with GSH-sensitive HMSiO2 NPs; (A) Cells were treated with 50 μg mL−1 of NPs and incubated for 4 h; (B) Cells were treated with 50 μg mL−1 of NPs and incubated for 24 h; (C) Cells were treated with 250 μg mL−1 of NPs and incubated for 4 h; and (D) Cells were treated with 250 μg mL−1 of NPs and incubated for 24 h. (A1-D1) Merge CLSM images under higher magnifications. Nuclei were stained in blue with Hoechst 33342 dye. NPs appeared with the green fluorescence of FITC. LysoTracker™ Deep Red dye was used to stain the lysosomes. As illustrated, NPs accumulated in the endolysosomal compartments and perinuclear regions. GSH-sensitive HMSiO2 NP uptake rate in MCF-7 cells measured by ICP-MS in terms of (E) NP concentration in the range of 0–1000 μg mL−1 with constant incubation time of 24 h and (F) incubation time in the range of 0–24 h with constant NP concentration of 100 μg mL−1. Results indicate that there is a threshold for the internalization of GSH-sensitive HMSiO2 NPs with the maximum uptake of c.a. 2.1% after incubation for 24 h. Cells without NP treatment were used as control. Data are mean ± SD (n = 3).

