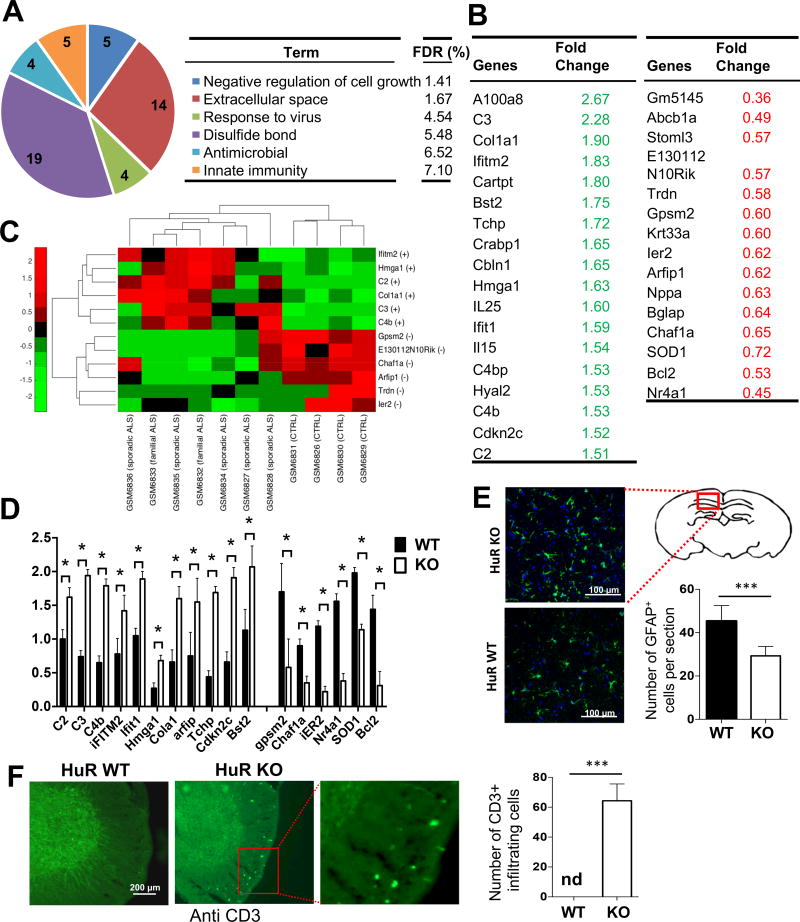
Fig. 4. Microarray analysis of brain tissue from neuron-specific HuR-deficient mice.
A. RNA samples from whole brain tissue of three pairs of experimental neuron-specific HuR-deficient mice and littermate control mice were analyzed on Affymetrix Mouse Gene 2.0 ST arrays. Differentially up- and down-regulated genes (>1.5-fold) were subjected to Ontology (GO) enrichment analysis. The significantly enriched (False Discovery Rate (FDR)<10%) GO terms and the numbers of pathway-associated genes are shown. B. Lists of selected differentially expressed transcripts identified by microarray analysis as described in Fig. 4A. C. Heatmap showing the level of expression of the selected transcripts in ALS patients and controls, which were differentially expressed between neuron-specific HuR-deficient and control mice. The plus (+) and minus (-) signs represent up- and down-regulation of transcripts, respectively. The expression profile was standardized along the row for better visualization. The red and green colors indicate high and low expression, respectively. D. Real-time PCR analysis of the selected transcripts (identified in microarray analysis) was performed for RNA samples from brain tissue of experimental neuron-specific HuR-deficient mice and littermate control mice. N=15 mice per group. Error bars represent s.d. of biological replicates. ***P<0.001 by by two-tailed Student’s t test. E. The representative confocal images of GFAP (green) staining in brain sections of experimental neuron-specific HuR-deficient and control mice as described in Fig. 1A. Nuclei were stained with DAPI (blue). Bar graph shows the number of GFAP-positive cells per section. N=15 mice per group and 5 sections per mouse were analyzed. Error bars represent s.d. of biological replicates. ***p<0.001 by Mann–Whitney test. F. Anti-CD3 stained thoracic spinal cord sections of experimental neuron-specific HuR-deficient and control mice as described in Fig. 1A. N=15 mice per group and 5 sections per mouse were analyzed. Error bars represent s.d. of biological replicates. ***p<0.001 by Mann–Whitney test.

