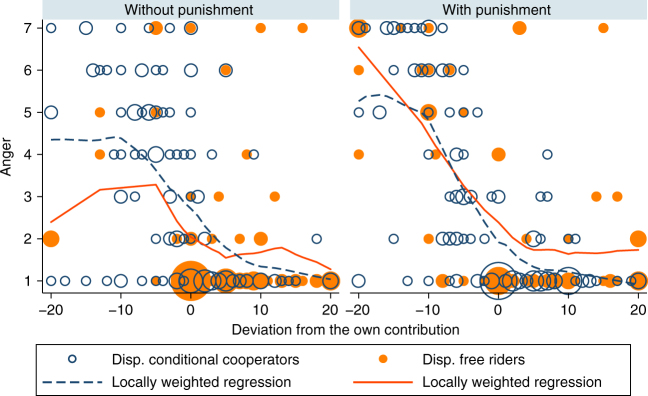
Fig. 2.
Self-reported anger levels depend on the deviation from the own contribution. Participants indicated the intensity of anger on a scale from 1 (not at all) to 7 (very much). The size of the bubbles corresponds to the number of observations at this location. The lines indicate the locally weighted regression functions of DCC (dark blue) and DFR (orange), and are very similar for both types. In both treatments, DCC and DFR feel angrier as group member’s negative deviations from the own contribution are higher

