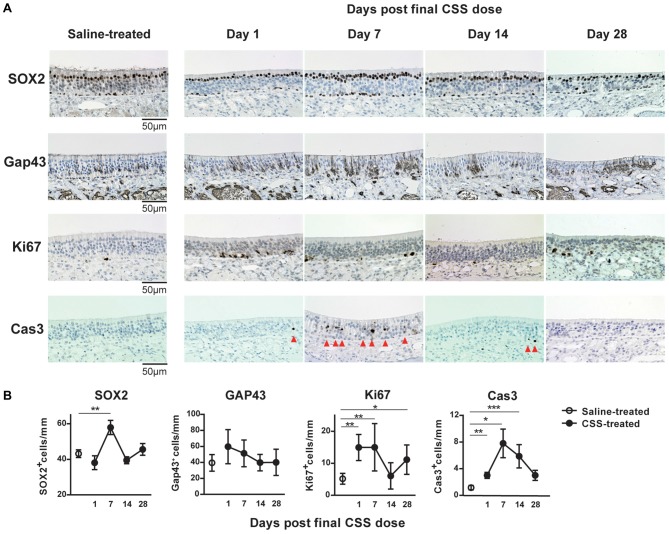
Figure 3.
(A) Representative images of immunohistological staining (brown) of SOX2+ olfactory receptor neurons (ORN) progenitor cells, Gap43+ immature ORNs, Ki67+ proliferating cells and cleaved caspase-3+ (Cas3+) apoptotic cells. Tissue sections were counterstained with the nuclear dye hematoxylin (blue). Arrowheads indicate Cas3+ apoptotic cells in the OE (n = 6). (B) Numbers of SOX2+ ORN progenitors and Ki67+ actively proliferating cells per mm of the basal layer, and Gap43+ immature ORNs and Cas3+ apoptotic cells per mm of the OE in saline or CSS-treated mice. Data represent means ± SEM (n = 6). *P < 0.05; **P < 0.01; ***P < 0.001 compared with saline-treated mice (one-way ANOVA).

