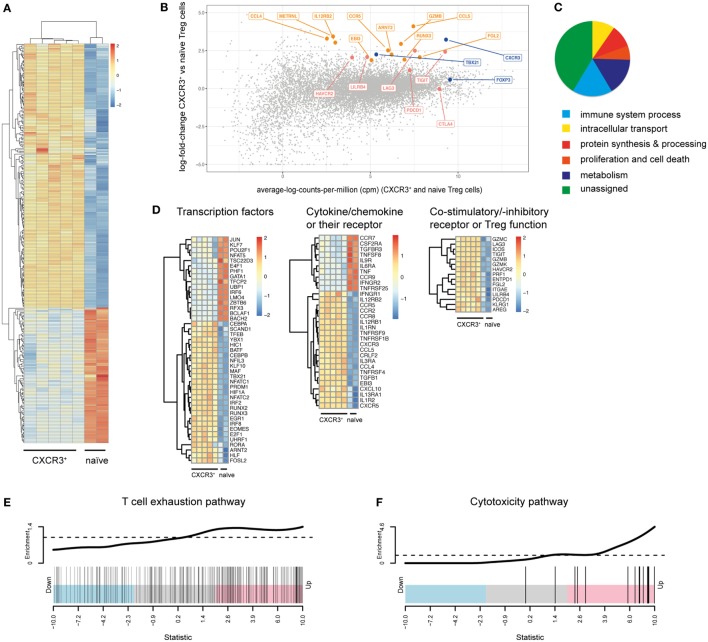
Figure 2.
CXCR3+ Treg cells show a distinct transcriptional profile. (A–D) Transcriptional profiling of CD4+Foxp3+CXCR3+ Treg cells from day 14 LCMV-infected mice and naïve CD4+Foxp3+ Treg cells sorted from pooled spleen and LNs of Foxp3-GFP reporter mice was performed using RNA-seq analysis. (A) Heat map of differentially expressed immune genes (log2 FC > 1, log2 cpm > 2). (B) Differential gene expression between CXCR3+ and naïve Treg cells. Control genes (blue), co-inhibitory receptor genes (red), and other immune genes (orange) are highlighted. (C) Pie-chart of differentially expressed genes (log2 FC > 1, log2 cpm > 2) assigned to the stated GO slim terms. (D) Heat map of transcription factor, chemokine (receptor) and cytokine (receptor), and Treg function related genes that are differentially expressed (log2 FC > 1, log2 cpm > 2) in CXCR3+ versus naïve Treg cells. (E,F) “Barcode” plots of changes in expression (CXCR3+ versus naïve Treg cells) in the context of T cell exhaustion (E) and cytotoxicity (F) pathways. Genes are ordered by Z-score (using p-values from the edgeR differential expression analysis, signed by the direction of change) and the genes within the pathway are shown with vertical black bars. The top line shows the relative enrichment of the vertical bars.

