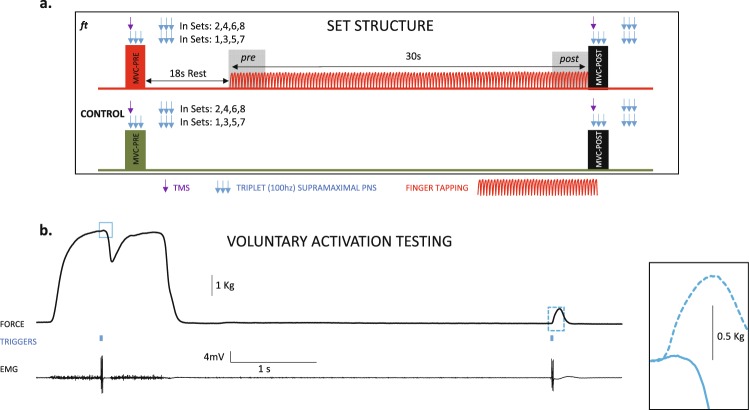
Figure 1.
Set structure for ft and control session and VA testing. (a) The ft and control sessions included 8 sets. The set started with an MVC-pre; after 18 sec of rest, subjects executed ft as fast as possible for 30 sec, which continued with an MVC-post (in red colour). From the grey-shaded areas (4 secs at the beginning and end of ft) we obtained the ft rate and amplitude, termed pre and post, respectively. During MVC (pre and post) in sets 1, 3, 5, and 7, we delivered a triplet PNS at the time of force’s plateau, and another triplet after 5.5s during the rest period. In sets 2, 4, 6, and 8, the stimulation during the MVC was TMS, but PNS was maintained at rest. In consecutive subjects, we reversed the order of PNS and TMS during MVC. (b) Example of the VA testing. Stimulation was delivered at the MVC plateau (see supporting video and figures). It is shown the force recording (up), the line of triggers (triple-PNS) (middle) and electromyographic activity. The insets on the right present an enlarged view of the twitches obtained during MVC and in the resting muscle. The Supporting Video displays the last seconds of a 30 s ft set, the execution of the MVC-post just at the end of ft, and the PNS (at MVC plateau and again in the resting potentiated muscle) to calculate the VA; the video was obtained with permission of the participant, in a different session from the experimental ones.

