Fig. 1.
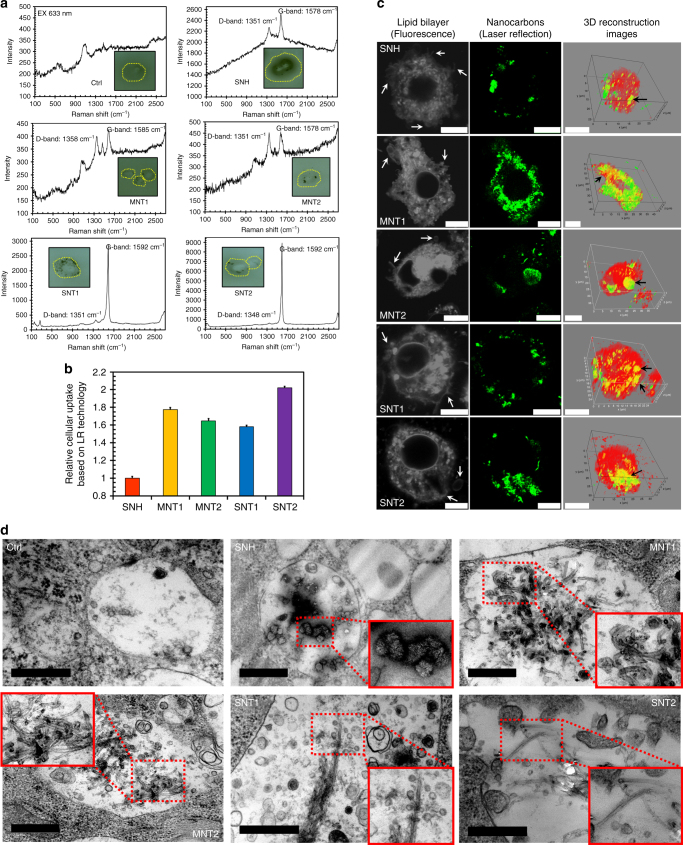
Macrophages internalized less SNH by phagocytosis compared to CNT. a Raman spectroscopy of intracellular nanocarbons after cellular incubations. The insert graphs showed the corresponding cells detected by microscope. b Relative cellular uptake comparison of five nanocarbons based on laser reflection (LR) signal detection (n = 3). c Confocal images of cells after nanocarbon incubations. Intracellular nanocarbons were detected by CLSM via LR technology. Cell membrane and endomembrane were stained with lipid dye DiI. White arrows indicated the membrane wrinkles. 3D reconstruction by Imaris software illustrated the co-localizations of nanocarbons with DiI-labeled vesicles (yellow spots, black arrows). Scale bar: 10 μm. d Transmission electron microscopy images of intracellular lysosomes after nanocarbon incubations. The magnified insets showed the significant morphological features of nanocarbons. Scale bar: 500 nm. In b, three independent nanocarbon incubations were performed in study. Data were expressed as mean ± s.d

