Fig. 2.
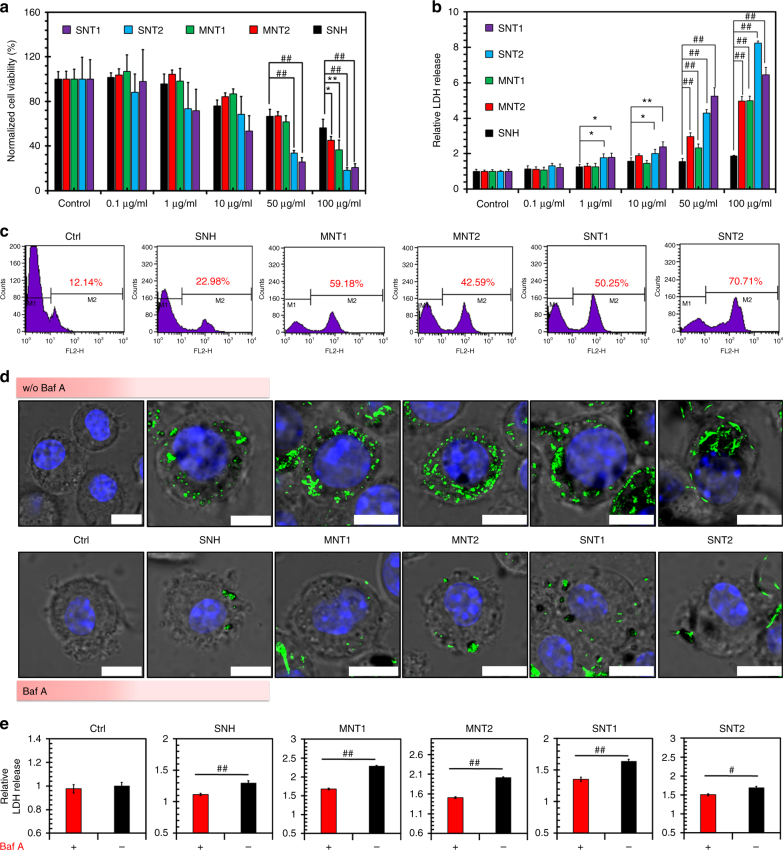
SNH caused lower nanotoxicity than CNT. a, b Cellular viability comparisons of different nanocarbons detected by a MTT assay and b LDH release investigations (n = 5). c Flow cytometry analysis of nanocarbon-incubated cells via PI labeling assay. d Confocal images of cells after nanocarbon incubations with and without Baf A addition. Intracellular nanocarbons were detected by laser reflection (LR) technology and shown with pseudo green color. Scale bar: 10 μm. e Cytotoxic analysis of different nanocarbons based on LDH release assay with and without Baf A addition (n = 4). In a, b, and e, data were presented as means ± s.d. Statistical significances were calculated by Student’s t-test: *p < 0.05, **p < 0.01, #p < 0.005, ##p < 0.001

