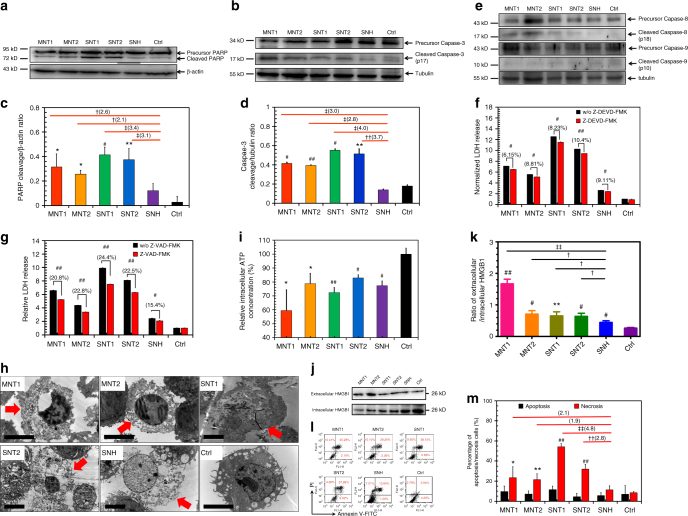
Fig. 3.
SNH-induced less apoptosis and necrosis than CNT. a, b Western blot analyses of a PARP and b caspase-3 cleavages after different nanocarbon incubations. c, d Quantitative cleavage ratio measurements of c PARP and d caspase-3 in nanocarbon-incubated cells according to the integrated optic density (IOD) value detection based on western blot imaging (n = 3). e Western blot analyses of caspase-8 and caspase-9 cleavages after nanocarbon incubations. f, g Cytotoxicity detections of different nanocarbons with and without two caspase inhibitors, f Z-DEVD-FMK and g Z-VAD-FMK) (n = 4). h Transmission electron microscopy images of dead cells caused by different nanocarbons. Red arrows showed the typical necrosis characteristics of cells. Scale bar: 5 μm. i Intracellular ATP detection after nanocarbon incubations (n = 4). j Immunoblot analysis of extracellular and intracellular HMGB1 after cellular incubations with different nanocarbons. k Quantitative ratio of extracellular HMGB1 to intracellular HMGB1accorind to the IOD detection based on WB imaging (n = 3). l Flow cytometry analysis of cells based on Annexin V/PI assay after nanocarbon incubations. m Quantitative comparison of apoptosis and necrosis caused by different nanocarbons detected by apoptosis/necrosis assay kit (n = 4). In c, d, f, g, i, k and m, data were presented as means ± s.d. Statistical significances were calculated by Student’s t-test. In c, d, k, and m, data were compared with control (Ctrl) and SNH groups separately. Versus Ctrl: *p < 0.05, **p < 0.01, #p < 0.005, ##p < 0.001. Versus SNH: †p < 0.05, ††p < 0.01, ‡p < 0.005, ‡‡p < 0.001. The values in brackets denoted the data ratios compared to SNH group. In f, g, data were compared with no inhibitor adding groups for each type of nanocarbons: #p < 0.005; ##p < 0.001

