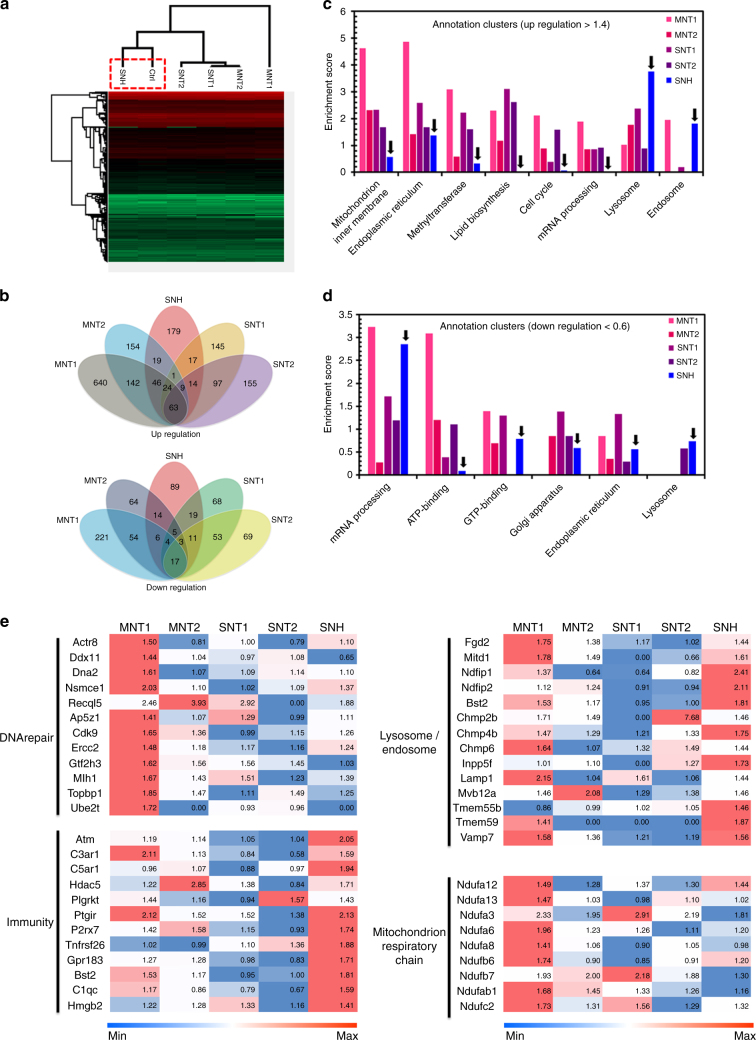
Fig. 4.
SNH generated less impact on protein expression than CNT. a Hierarchical clustering analysis on the changes of cellular proteins investigated by LFQ proteomics after incubation of nanocarbons. b The Venn diagrams of cellular proteins with more than 40% expression change over control group after treatment of nanocarbons. c, d The gene functional annotation clustering of the c upregulated and d downregulated proteins based on enrichment analysis after the incubation of different nanocarbons. e The heat maps on the expression comparison of changed proteins that involved in part of key cellular processes after the incubation of nanocarbons. The values in heat maps represented the expression ratios of identified proteins compared to control group

