Fig. 5.
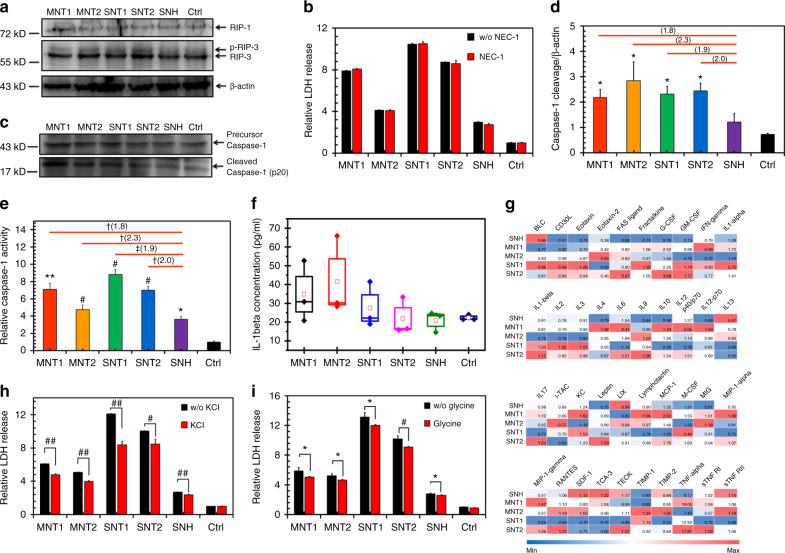
SNH triggered less pyroptosis than CNT. a Western blot analyses of RIP1 and RIP3 kinases after nanocarbon incubations. b Cytotoxicity detection of different nanocarbons with and without RIP-specific inhibitor NEC-1 addition (n = 4). c Western blot analysis of caspase-1 cleavage induced by different nanocarbons. d Quantitative cleavage ratio measurement of caspase-1 in nanocarbon-incubated cells based on the integrated optic density (IOD) value detection during western blot imaging process (n = 3). e Caspase-1 activity determination after cellular incubations of different nanocarbons based on specific assay kit (n = 3). f Extracellular IL-1β measurement induced by different nanocarbons detected by ELISA. Each data point represented an independent detection, and the box denoted the standard deviation for each group (n = 3). g The heat map of extracellular inflammatory cytokines induced by nanocarbons based on the protein array technology. The data in map represented the secretion changes of cytokines caused by nanocarbons compared to control group. h, i Cytotoxicity detections of different nanocarbons with and without two pan-inhibitors of pyroptosis, g KCl and h glycine additions (n = 4). From b to h, data were all presented as means ± s.d. and the statistical significances were calculated by Student’s t-test. In d and e, data were compared with control (Ctrl) and SNH groups respectively. Versus Ctrl: *p < 0.05, **p < 0.01, #p < 0.005, ##p < 0.001. Versus SNH: †p < 0.05, ††p < 0.01, ‡p < 0.005. The values in brackets denoted the data ratios compared to SNH group. In g and h, data were compared with no inhibitor adding groups for each type of nanocarbons: *p < 0.05; #p < 0.005; ##p < 0.001

