Fig. 6.
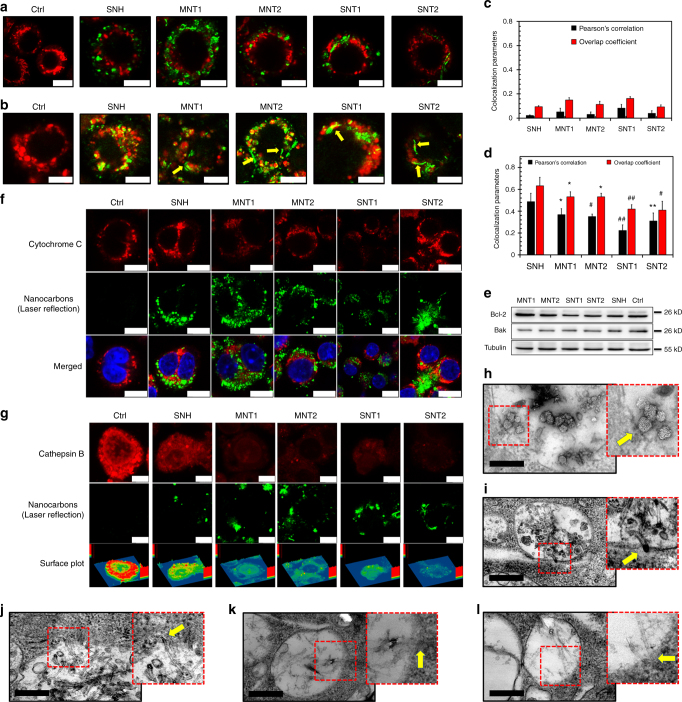
SNH initiated less lysosome stress than CNT. a Co-localization images of intracellular nanocarbons (pseudo green color, laser reflection detection) with mitochondria (red color, labeled with MitoTracker) detected by CLSM. Scale bar: 7.5 μm. b Co-localization images of intracellular nanocarbons (pseudo green color, laser reflection detection) with lysosomes (red color, labeled with LysoTracker) viewed by CLSM. Yellow arrows indicated the penetrations of CNT through lysosome membrane. Scale bar: 7.5 μm. c, d Co-localization parameter measurements of different nanocarbons with c mitochondria and d lysosomes respectively based on CLSM investigations (n = 5). e Western blot analyses of Bcl-2 and Bak after nanocarbon incubations. f, g Intracellular distribution images of two organelle-specific proteins, f Cytochrome C (mitochondria location) and g Cathepsin B (lysosome location) after the cellular incubations of nanoarbons. Scale bar in f and g: 10 μm. h–l Transmission electron microscopy images of the interactions of different nanocarbons with lysosome membrane. The insert graphs indicated the moderate contact of h SNH with membrane, and the striking membrane penetrations for i MNT1, j MNT2, k SNT1, and l SNT2. Scale bar in h–l: 500 nm. In c and d, data were presented as means ± s.d. Statistical significances were calculated by Student’s t-test. Data were all compared with control (Ctrl) group: *p < 0.05, **p < 0.01, #p < 0.005, ##p < 0.001

