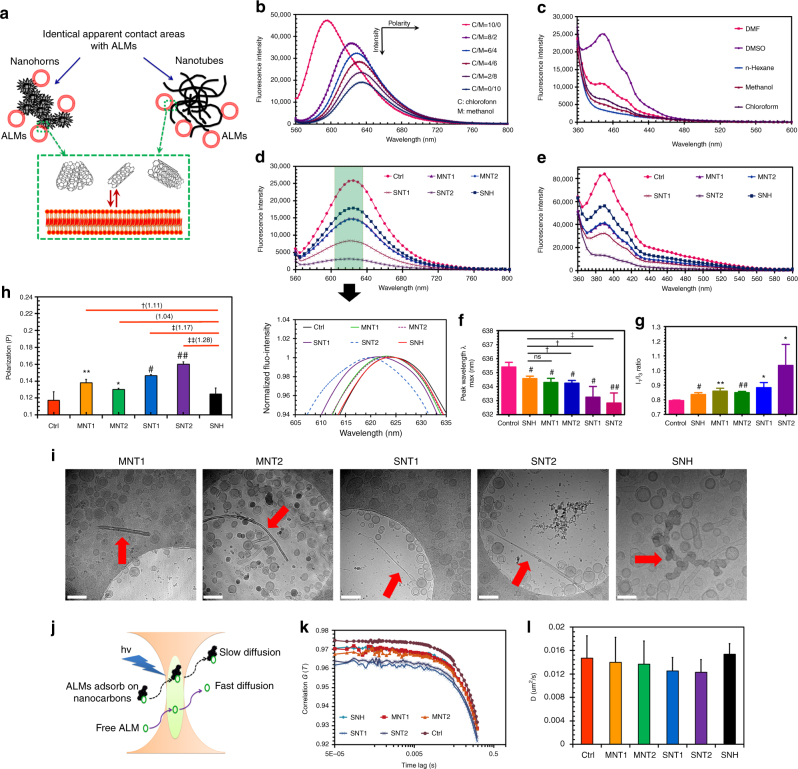
Fig. 7.
SNH brought lower membrane disturbance than CNT. a Schematic of membrane interactions induced by different nanocarbons. Artificial lipid membranes (ALMs) were fabricated in the investigations. Since nanocarbons usually assembled in aqueous medium, the mass concentrations of five nanocarbons were modulated to keep the identical apparent contact area, which was calculated based on hydrodynamic radius (RH). b, c Fluorescence spectrums of two environment sensitive probes, b nile red and c pyrene in solvents with different polarities. d, e Fluorescence spectrums of ALMs labeled with d nile red and e pyrene respectively after different nanocarbon incubations. The insets represented the normalized spectrums of fluorescent ALMs near emission peaks. f The comparison of λmax after the incubation of nanocarbons with ALMs. Three independent spectrum scanning were performed in each experiment group. g The quantitative detection of I1/I3 after nanocarbon incubation based on the spectrum scanning of pyrene-labeled ALMs (n = 3). h Polarization (P) measurements of ALMs labeled with DPH after the incubations of different nanocarbons (n = 4). i Cryo-transmission electron microscopy images of ALMs after different nanocarbon incubations. Red arrows showed the nanocarbons in aqueous medium. Scale bar: 100 nm. j Schematic of fluorescence correlation spectroscopy (FCS). Fluorescent ALMs that bound with nanocarbons could be distinguished from free ALMs by FCS because of the reduced diffusion rates. k Autocorrelation curves of ALMs after nanocarbon incubations detected by FCS. l Diffusion coefficient detection of ALMs after different nanocarbon incubations based on autocorrelation curve fitting (n = 12). In f, g, h, and l, data were presented as means ± s.d. Statistical significances were calculated by Student’s t-test. Data were compared with control (Ctrl) and SNH groups respectively. Versus Ctrl: *p < 0.05, **p < 0.01, #p < 0.005, ##p < 0.001. Versus SNH: †p < 0.05, ††p < 0.01, ‡p < 0.005, ‡‡p < 0.001. The values in brackets denoted the data ratios compared to SNH group

