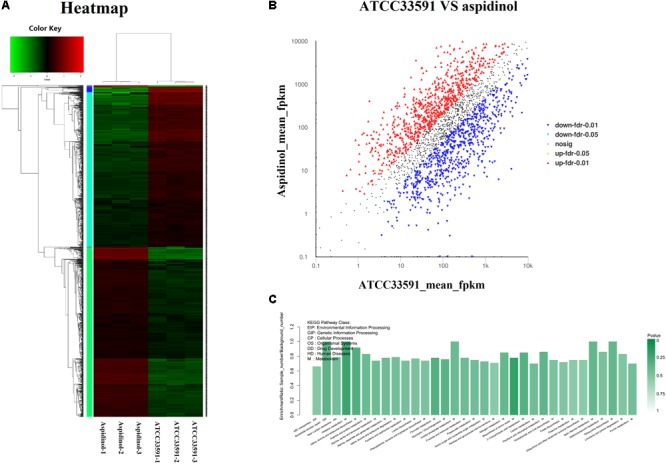
FIGURE 4.

RNA-Seq gene expression results for S. aureus ATCC 33591 cells treated and not treated with aspidinol. (A) A heatmap generated comparing aspidinol-treated cells to untreated control S. aureus ATCC 33591 cells is shown. Triplicate samples were used for each group. (B) Volcano plot analyses of unigenes in aspidinol and the ATCC 33591 group. (C) Differentially expressed genes enriched in the KEGG pathway.
