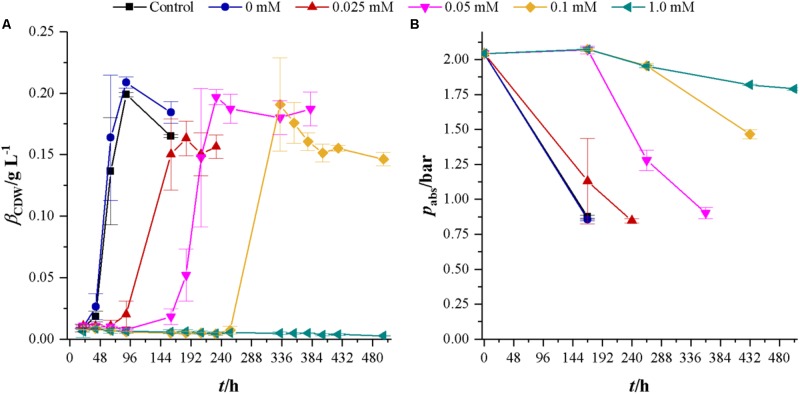
FIGURE 4.
Development of CDW and headspace pressure of cultivations of C. ljungdahlii in the presence of different cyanide concentrations with syngas as a carbon and energy source. Each value is an average of three cultivations. Control cultures (black squares) do not contain any phosphate buffer or cyanide while cultures with 0 mM cyanide (blue dots) contain 1 mL of 100 mM potassium phosphate buffer at pH 11. Other cyanide concentrations are 0.025 (red triangles), 0.05 (magenta upturned triangles), 0.1 (yellow diamonds), and 1.0 mM (petrol tilted triangles). (A) CDW and (B) mass concentration of fructose. Average values of three independent cultivations.

