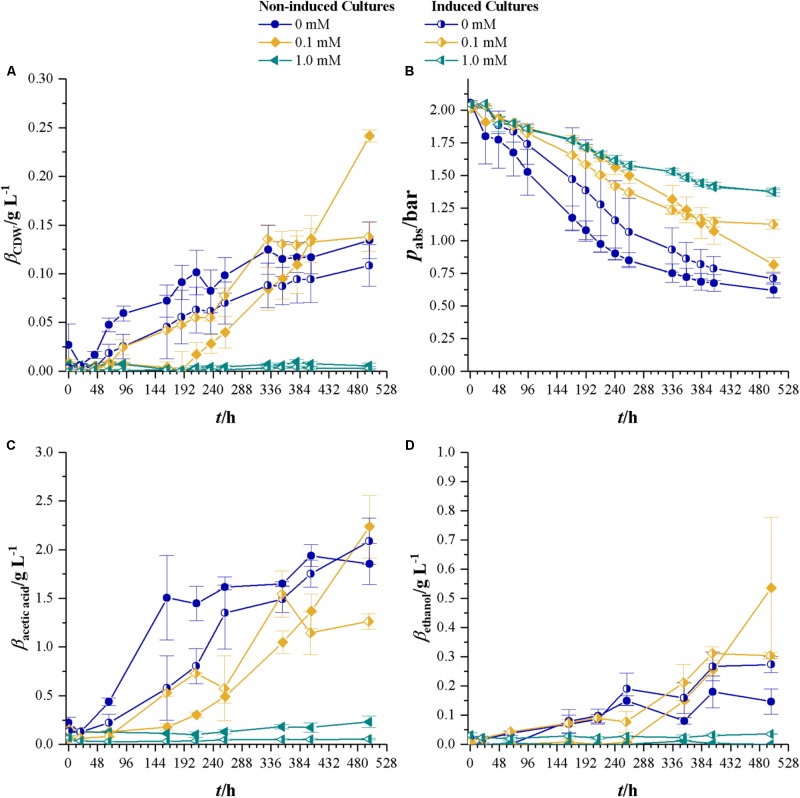
FIGURE 5.
Non-induced C. ljungdahlii (full symbols) vs. the induced strain (half-filled symbols) at different cyanide concentrations with syngas as a carbon and energy source. Cyanide concentrations are 0 (blue dots), 0.1 (yellow diamonds), and 1.0 mM (petrol tilted triangles). (A) CDW; (B) mass concentration of fructose; (C) mass concentration of acetic acid; and (D) mass concentration of ethanol. Average values of three independent cultivations. Average data from triplicate experiments.

