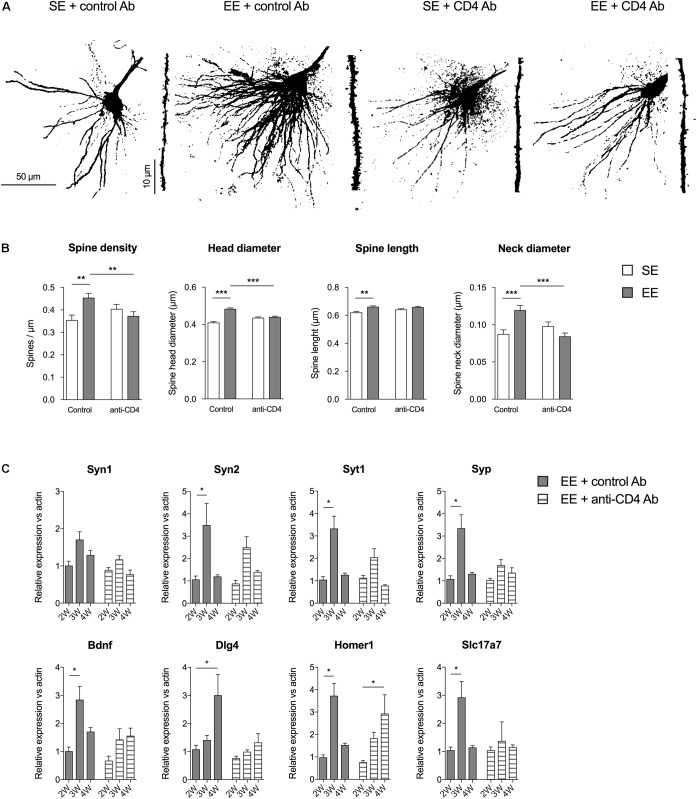
FIGURE 2.
CD4+ T cell depletion affects spine density and morphology in pyramidal neurons of CA1. (A) Representative photomicrographs of CA1 pyramidal neurons of the hippocampus labeled with Alexa Fluor 568 from mice raised in SE or EE and treated with control or anti-CD4 Ab. (B) CD4+ T cell depletion modifies EE-induced spinogenesis and dendritic spine morphology in CA1 neurons. Spine characteristics (number of spines/μm, mean spine head diameter, mean spine neck diameter, mean spine length) were determined using NeuronStudio on segments of dendrites of 45–50μm at the second basilar dendrites of CA1 neurons labeled with Alexa Fluor 568. Bars are means ± SEM. SE is in white and EE is in gray. ∗∗p < 0.01 and ∗∗∗p < 0.001. Mann–Whitney test for comparison between groups was performed (Table 2). (C) CD4+ T cell depletion blocks EE-induced expression increases for synaptic factor genes in the CA of the hippocampus. CA were micro-dissected from hippocampus tissue and transcript abundance of neurotrophic genes was determined by RT-qPCR after different durations of housing (2W, 3W, and 4W) in SE or EE conditions. Bars represent the mean expression levels ± SEM of the 2-ΔΔCt. For each gene, we first performed a Kruskal–Wallis test on the ΔCt values followed by an exact two-sample Fisher-Pitman permutation test comparing SE to EE at 3W and 4W, and comparing in each group (SE or EE) 3W to 2W and 4W to 2W. The p values were corrected using the FDR method of Benjamini–Hochberg for a total of eight comparisons per gene. ∗p < 0.05 and ∗∗p < 0.01, N = 6 for each group.

