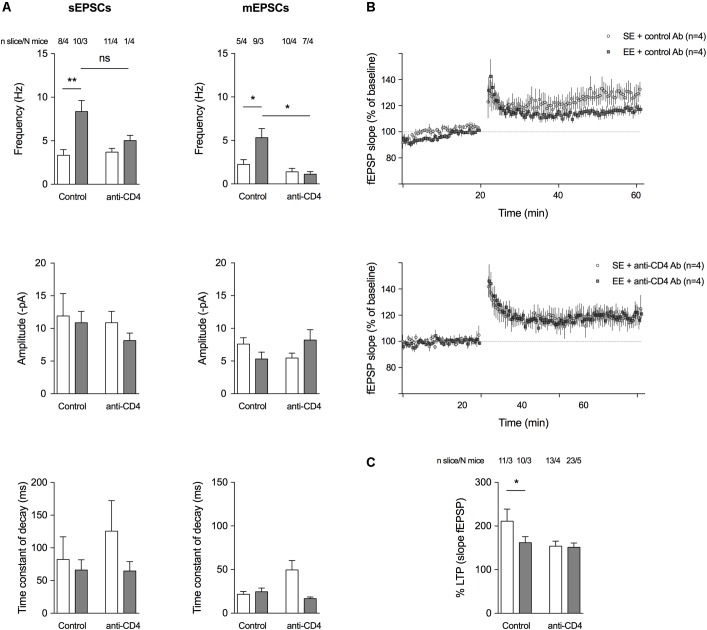
FIGURE 3.
CD4+ T cell depletion affects spontaneous and miniature activities on pyramidal CA1 neurons and LTP at the CA3-CA1 synapse. (A) Histograms representing event frequency, event amplitude, and the time constant of decay of spontaneous (left) and miniature (right) EPSCs recorded in pyramidal CA1 neurons by patch clamp in a whole cell configuration. SE is in white, and EE is in gray. Number of neurons and mice used are indicated at the top. C ∗p < 0.05, ∗∗p < 0.01, Mann–Whitney test for comparison between groups was performed. (B) Field excitatory postsynaptic potentials (fEPSPs) recorded in the CA1 region of the hippocampus in response to a stimulation of Schaffer collaterals every 30 s. Stimulating intensity was chosen to trigger a fEPSP of 50 % of the maximum response. After a stable baseline of 20 min, the high-frequency stimulation (HFS) protocol was applied (100 Hz during 1 s). Then, the 30 s stimulation with the same intensity was restarted and a potentiation of the response to the stimulation was observed as expected, to 125–300 % of the initial response. Curves show the time course of the slope amplitude of the EPSPs for an average of representative slices of each group of mice, a group raised for 8 weeks in SE and a group raised for 4 weeks in EE from 4 weeks of age (N = 4 each). LTP was established in both groups after the HFS, but its magnitude was less pronounced in the group of mice raised for 4 weeks in EE. (C) Histograms showing the mean amplitude of LTP ± SEM measured 40 min after HFS according to the different conditions. SE is in white and EE is in gray. Number of slices and mice used are indicated at the top. ∗p < 0.05. Mann–Whitney test for comparison between groups was performed.

