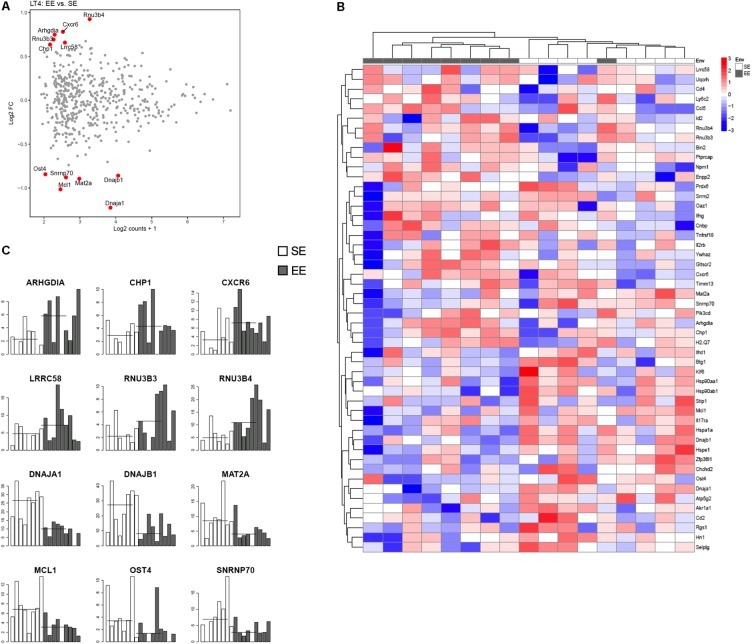
FIGURE 4.
Transcriptomic analysis of CD4+ T cells from choroid plexus of mice raised in EE and SE. (A) MA-plot for the comparison between enriched and standard environments for CD4+ T cells from choroid plexus tissue. X-axis: average gene expression levels measured as log2 UMI counts + 1. Y-axis: log2 Fold-Change between EE and SE. Red dots: differentially expressed genes, selected based on a combination of p value < 0.01, abs(log2 Fold-Change) > 1 and average expression > 2. (B) Gene expression levels of the 12 genes exhibiting the most significant differences between Enriched and Standard Environments in CD4+ T cells from choroid plexus tissue. Data are expressed as UMI counts (Table 3). (C) Heatmap of the 50 most differentially expressed genes when comparing plexus choroid CD4+ T cells from enriched and standard environments. Expression levels are gene centered, so that all genes have an average expression level equal to zero. Hierarchical clustering of the samples and genes used Euclidean distance and complete linkage. Note: the differences in gene expression levels between EE and SE are small for this condition, and the hierarchical clustering is not able to separate EE and SE samples as clearly as in the other conditions.

