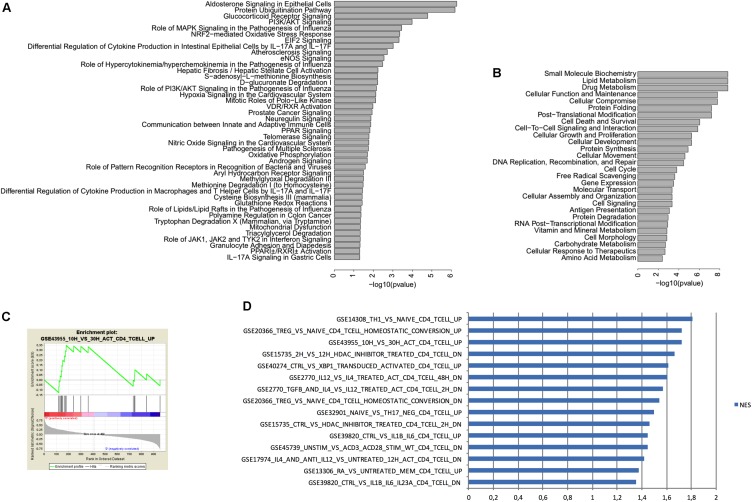
FIGURE 5.
IPA and GSEA analysis of genes expressed in CD4+ T cells from the choroid plexus from EE mice vs. SE mice. (A) IPA Canonical pathways associated with differentially expressed genes (i.e., increased or decreased) when comparing CD4+ T cells between enriched and standard environments. We used IPA to compare the variation in gene expression observed in CD4+ T cells between enriched and standard environments (increase or decrease) to the gene variations observed in canonical pathways. The more significant pathways are indicated and bars represent the strength of the statistical significance. (B) IPA Molecular functions associated with differentially expressed genes (i.e., increased or decreased) when comparing CD4+ T cells between enriched and standard environments. We used IPA to compare the variation in gene expression observed in CD4+ T cells between enriched and standard environments (increase or decrease) to the gene variations associated with molecular functions. The more significant molecular functions are indicated and bars represent the strength of the statistical significance. (C) Example of an enrichment plot obtained using GSEA by comparison of the CD4+ T cells from the plexus (enriched vs. standard environment) to the C7 immunology set of data. (D) Top pathways obtained in GSEA for genes enriched in CD4+ T cells from the choroid plexus (EE mice vs. SE mice) with the higher NES. We considered only the pathways containing in their names “CD4” but not “CD8” or “transfected”.

