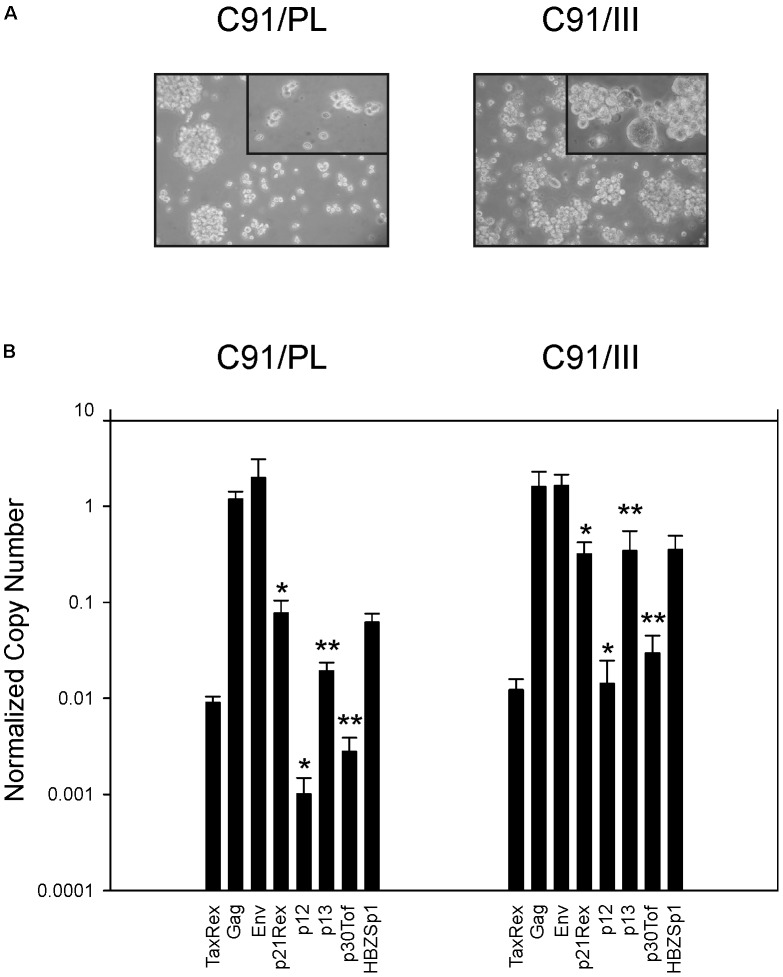
FIGURE 3.
Morphologic and viral characterization of C91/PL and C91/III cell lines. (A) Phase contrast images of C91/PL and C91/III cells in standard culture conditions. The tumorigenic C91/III cell line showed a higher percentage of multinucleated giant cells. Original magnification 100×; Upper right-end side insert 200×. (B) Profile of Human T cell Leukemia Virus type 1 (HTLV-1) transcripts. C91/III cells showed a statistically significant increase in the normalized copy number (NCN) of all transcripts encoding the viral accessory proteins compared to C91/PL cells. NCN values were calculated by normalizing the absolute copy number of each transcript for the copy number of the glyceraldehyde 3-phosphate dehydrogenase (GAPDH) transcripts. Values are the mean of three independent measurements performed in triplicate; standard error bars are shown. ∗p < 0.05, ∗∗p < 0.01.

