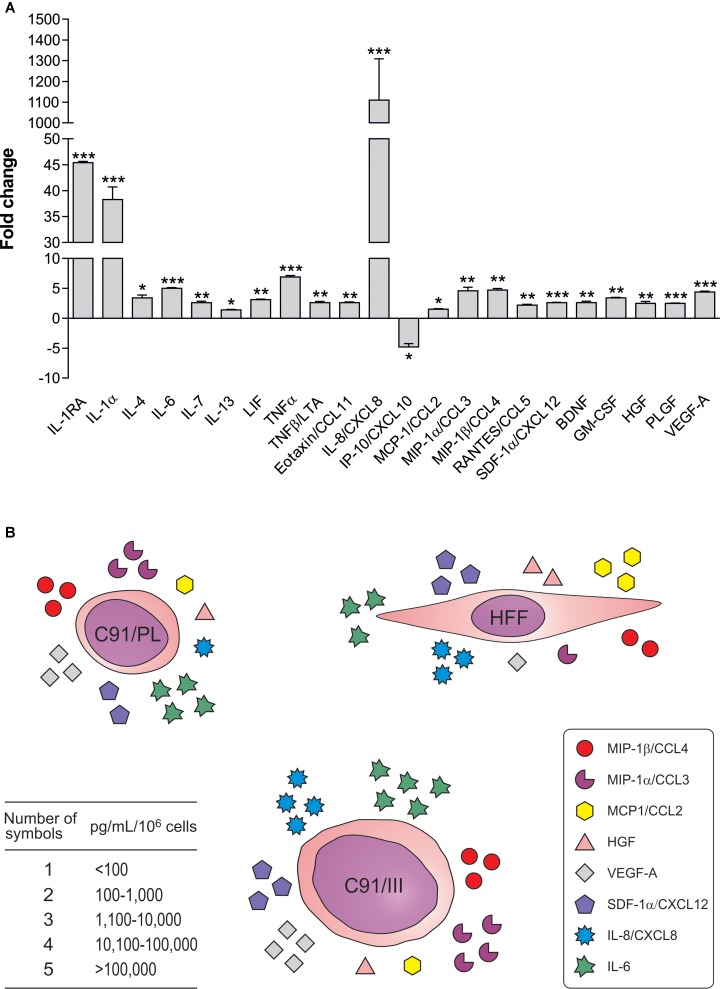
FIGURE 4.
Soluble factors differentially released by C91/III cells. (A) Data are reported as ratio between the mean of the values, expressed in pg/mL/106 cells, measured in the supernatants of C91/III cells and in the supernatants of C91/PL cells; standard deviations of the ratio are calculated according to the theory of error propagation (Calabro et al., 2009). Only significantly different soluble factors are shown, and statistical significance is referred to the comparison of the concentration values between the two cell lines, calculated by two-tailed Student’s t-test. ∗p < 0.05, ∗∗p < 0.01, ∗∗∗p < 0.001. (B) The figure schematically shows that some of the soluble factors increased in the lymphomagenic cells belong to the HFF secretory profile, suggesting that C91/III cells acquired an autocrine stimulatory loop, becoming independent from HFF support.

