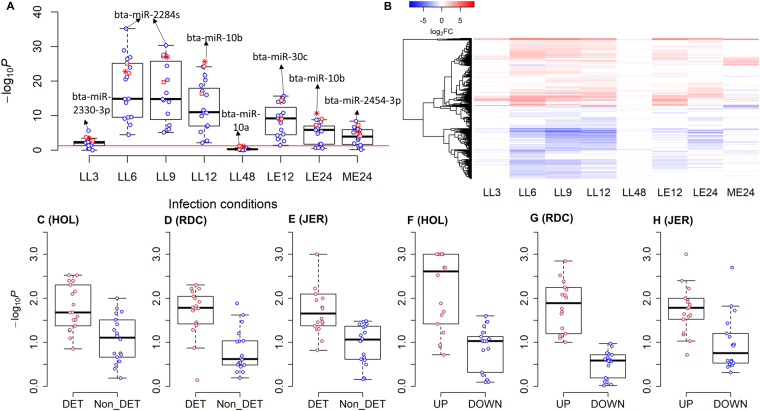
Figure 7.
Integrative analyses of infection-relevant transcriptome data with significant mastitis miRNA target-networks. (A) The enrichments for targets in mastitis miRNA target-networks with differently expressed genes (DEGs) that are detected in different infection conditions. Each point is a miRNA target-network. The significance (−log10P) is determined using hypergeometric test. The red line corresponds to P = 0.05. The red square, star and circle represent bta-miR-6525, bta-miR-10b and bta-miR-10a, respectively, which are shared between mastitis and milk yield. LL3, LL6, LL9, LL12 and LL48 represent the comparisons of 3, 6, 9, 12 and 48 h post intra-mammary infection with LPS to the control time-point (−22h), respectively in liver. LE12 and LE24 represent the comparisons of 12 and 24 h post intra-mammary infection with E. coli to the control time-point (−144h), respectively in liver. ME24 represents the comparison of the infected udder quarters to the control ones at 24 h post intra-mammary infection with E. coli. (B) The heatmap of log2(fold-change, FC) of differentially expressed target (DETs) of mastitis-associated miRNAs. (C–E) Represent the difference in the enrichments of association signals of mastitis between DETs and non-DE targets (N_DETs) of mastitis-associated miRNAs for HOL, RDC and JER, respectively. (F–H) Represent the difference in the enrichments of association signals of mastitis between up- (UP) and down- (DOWN) regulated DETs of mastitis-associated miRNAs for HOL, RDC and JER, respectively.

