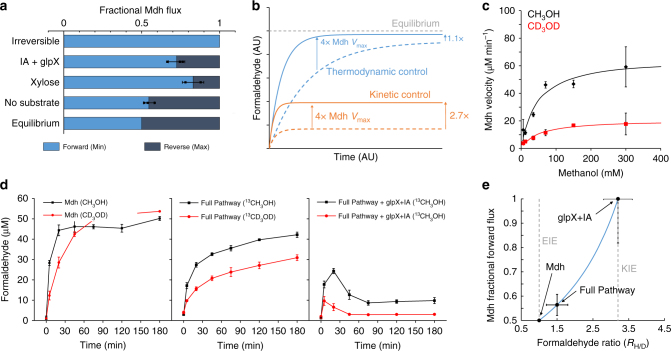
Fig. 6.
Thermodynamic and kinetic isotope effect analysis reveal Mdh kinetics limit methanol assimilation flux. a Upper bounds on in vivo reversibility of Mdh derived from steady-state measurements of formaldehyde in cells with Mdh or the full pathway (Mdh, Hps, and Phi), and NAD/NADH ratios. Light blue bars represent minimum fraction of Mdh flux in forward direction, and dark blue bars represent maximum fractional reverse flux. Hypothetical “Equilibrium” and “Fully Irreversible” scenarios are plotted for comparison to experimental results under various conditions. b Dynamic simulations of formaldehyde concentration for a hypothetical assimilation pathway where formaldehyde concentration is close to equilibrium (blue) and far from equilibrium (orange), showing the effect of increasing the Vmax of Mdh by a factor of 4 in each case. c Michaelis plot of Mdh activity with CH3OH (black) and CD3OD (red), highlighting the kinetic isotope effect (KIE) associated with deuterated methanol. d Formaldehyde concentrations over time after treatment with 250 mM 13CH3OH (black) or 250 mM 13CD3OD (red) of E. coli MG1655(DE3) ΔfrmA starved cells containing various plasmids: Left, Mdh-only; Middle, full pathway (Mdh, Hps, and Phi); Right, full pathway + glpX with iodoacetate (IA) treatment. e The fraction of total Mdh flux in the forward direction is plotted as a function of the ratio of steady-state formaldehyde concentrations with protonated or deuterated methanol (blue line, Eq. (2)), with experimentally measured values indicated (orange circles). The minimum and maximum formaldehyde ratios are defined by the equilibrium isotope effect (EIE) and kinetic isotope effect (KIE), respectively. Error bars represent s.d. of n = 3 biological replicates (three individual colonies), except for c in which case they represent s.d. of n = 2 technical replicates

