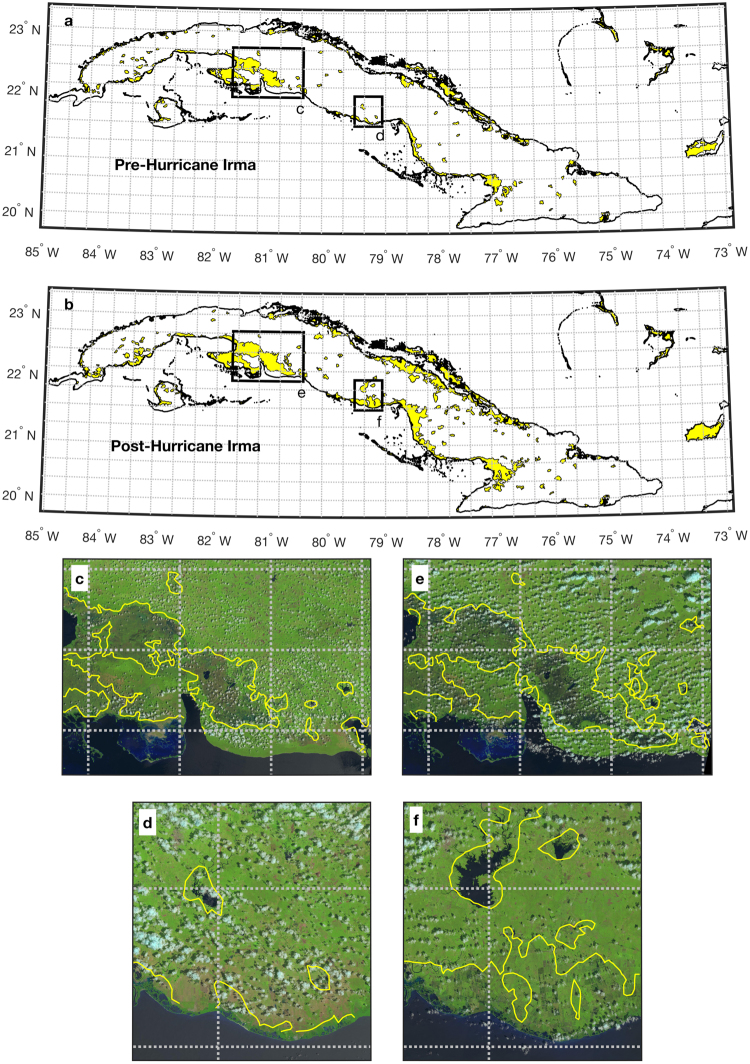
Figure 4.
Map of inundated areas in Cuba before (a) and after (b) Hurricane Irma (yellow filled contours). (c and d) are insets of the black outlined boxes in (a) overlaid on optical images from Landsat before30 (Sept 7, 2017) and after31 (Oct 9, 2017) Hurricane Irma. (e and f) are insets of the black outlined boxes in (b) overlaid on Landsat images before32 (Aug 31, 2017) and after33 (Oct 2, 2017) Hurricane Irma. Grey dashed boxes are spatial footprints of the SMAP satellite.

