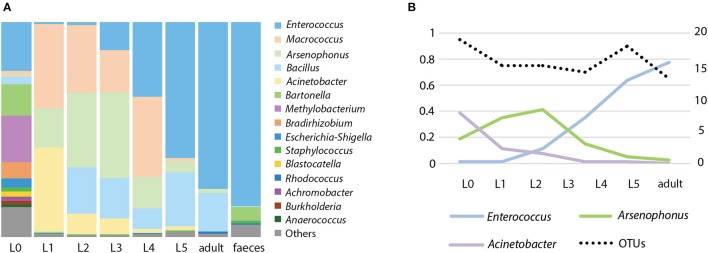
Figure 2.
Microbiome of R. prolixus along its ontogeny. (A) Relative abundance of the main genera in different developmental stages. L0 stands for eggs, L1-L5 are nymphal instars. (B) Variation of the dominant OTUs; percentage of the total reads number (left axis) and number of OTUs in individual stages (right axis).

