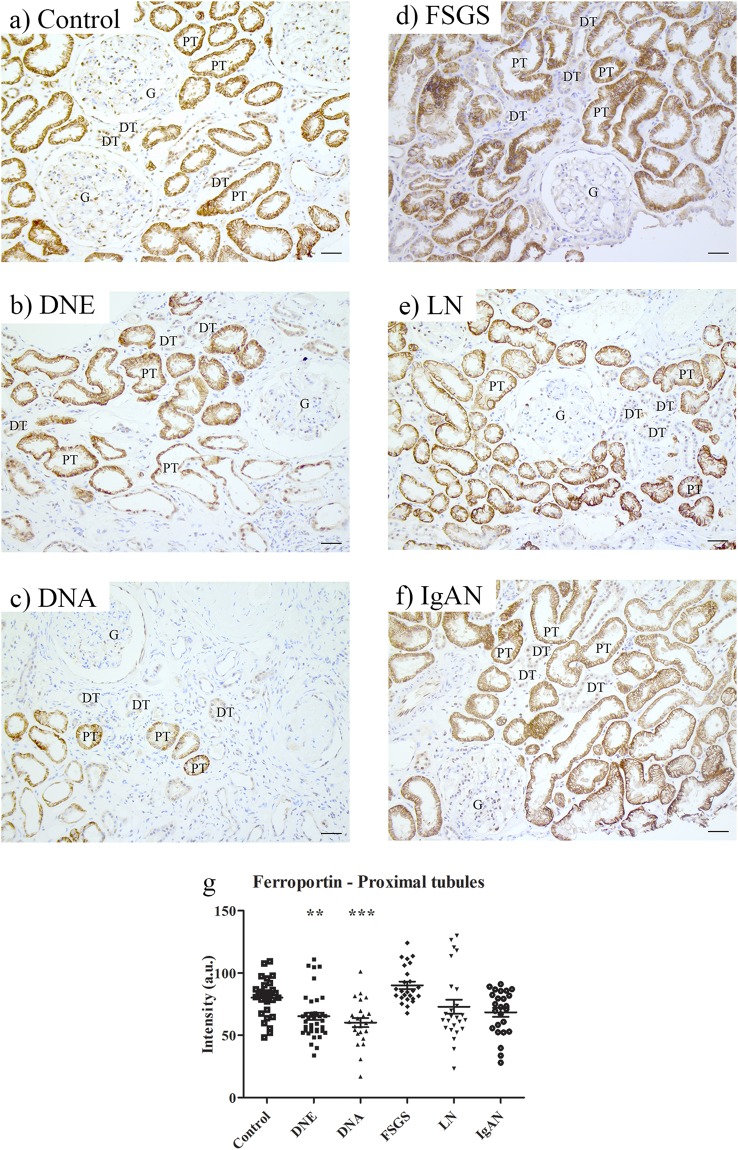
Figure 5.
Immunohistochemistry of cellular iron export protein in chronic kidney disease. Representative images of ferroportin staining in control (a), early diabetic nephropathy (DNE; b), advanced diabetic nephropathy (DNA; c), focal segmental glomerulosclerosis (FSGS; d), lupus nephritis (LN; e), and IgA nephropathy (IgAN; f). Intensity quantified (g) in proximal tubules. Dots represent all quantified images (5 images per biopsy). Renal structures indicated as glomerulus (G), proximal tubule (PT), distal tubule (DT). Scale bar 40 µM. **p < 0.01; ***p < 0.001.

