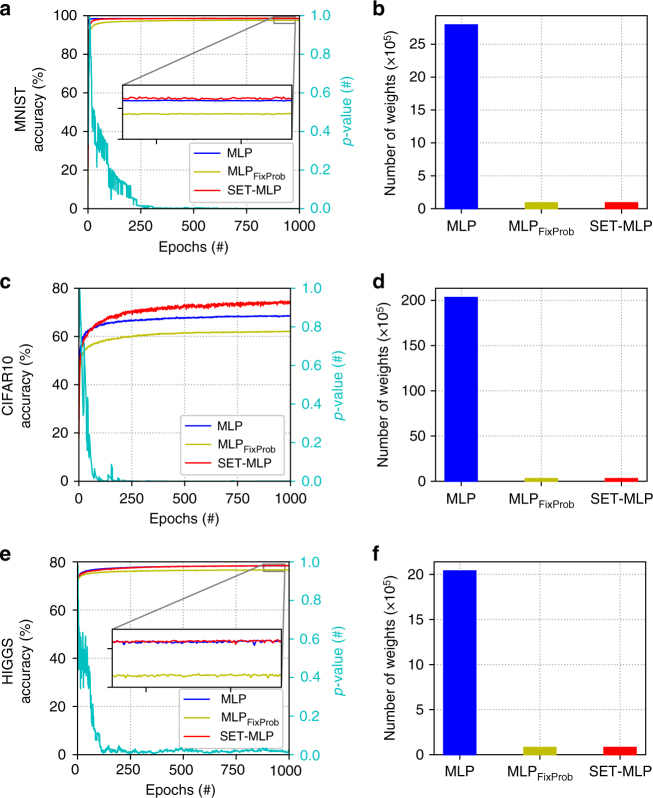
Fig. 5.
Experiments with MLP variants using three benchmark datasets. a,c,e reflect models performance in terms of classification accuracy (left y axes) over training epochs (x axes); the right y axes of a,c,e give the p-values computed between the degree distribution of the hidden neurons of the SET-MLP models and a power-law distribution, showing how the SET-MLP topology becomes scale-free over training epochs. b,d,f depict the number of weights of the three models on each dataset. The most striking situation happens for the CIFAR10 dataset (c,d) where the SET-MLP model outperforms drastically the MLP model, while having ~100 times fewer parameters

