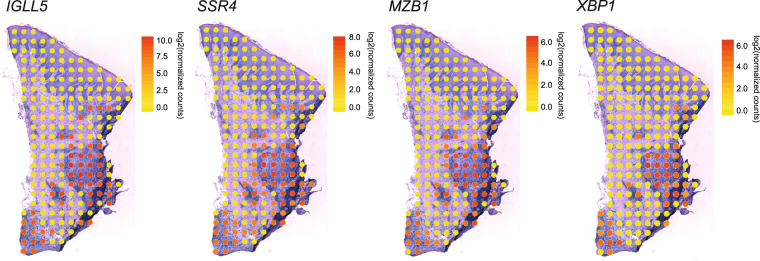
Figure 3.
Distribution of gene activity of the four genes up-regulated to the greatest extent in areas of inflammatory cells compared to areas without inflammatory cells. The gene expression distribution of immunoglobulin lambda-like polypeptide 5 (IGLL5), signal sequence receptor subunit 4 (SSR4), marginal zone B and B1 cell specific protein (MZB1) and X-box binding protein 1 (XBP1) are shown. Yellow spots correspond to low expression of IGLL5, SSR4, MZB1, or XBP1, whereas red spots correspond to high gene expression. All count values have been normalized and log2 transformed.

