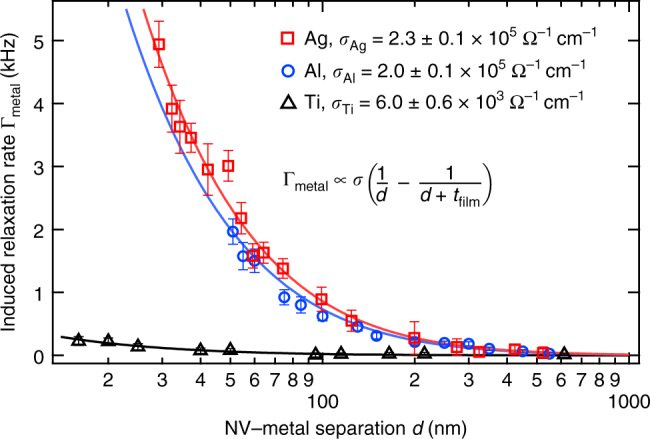
Fig. 2.

Quantitative conductivity measurements using the NV center. Plotted is the metal-induced NV center relaxation rate Γmetal as a function of NV distance d from 85-nm thick films of Ag (red squares), Al (blue circles), and Ti (black triangles). For each curve the intrinsic relaxation rate of the NV is measured and subtracted to isolate Γmetal. The fits (solid curves) yield the conductivity values shown. Error bars correspond to the standard error in the fit to a full T1 measurement at each point
