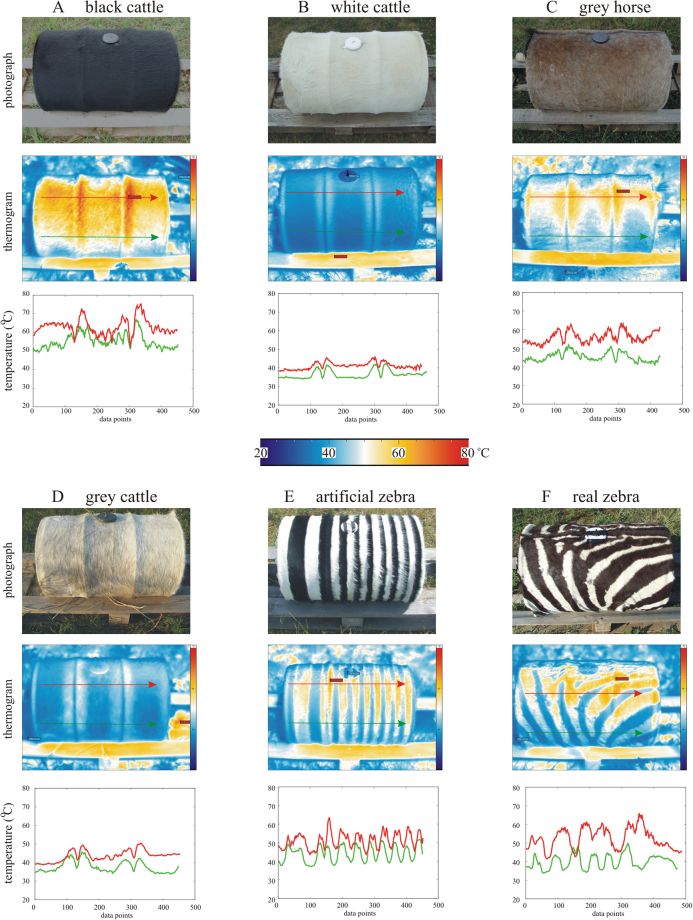
Figure 3.
Thermography of barrels used in the experiments. Photographs (taken by Gábor Horváth) and thermograms of the six sunlit barrels covered by different hides (black cattle, white cattle, grey horse, grey cattle, artificial zebra, real zebra) used in our experiments 3 and 4, and the change of surface temperature T (°C) along straight lines marked with arrows in the thermograms. The upper (red) and lower (green) arrow runs on a sunlit and shady region of the barrel shell, respectively. The beginning and the end (head) of the arrows correspond to the first and last data points of the T-curves, respectively. In the thermograms red, yellow, white, light blue and dark blue colour hues code hot, warm, medium, cool and cold temperatures, respectively. In E and F, the large T-differences between adjacent black and white stripes are visible both in the thermograms and the T-curves. The photographs were taken independently of the thermograms.

