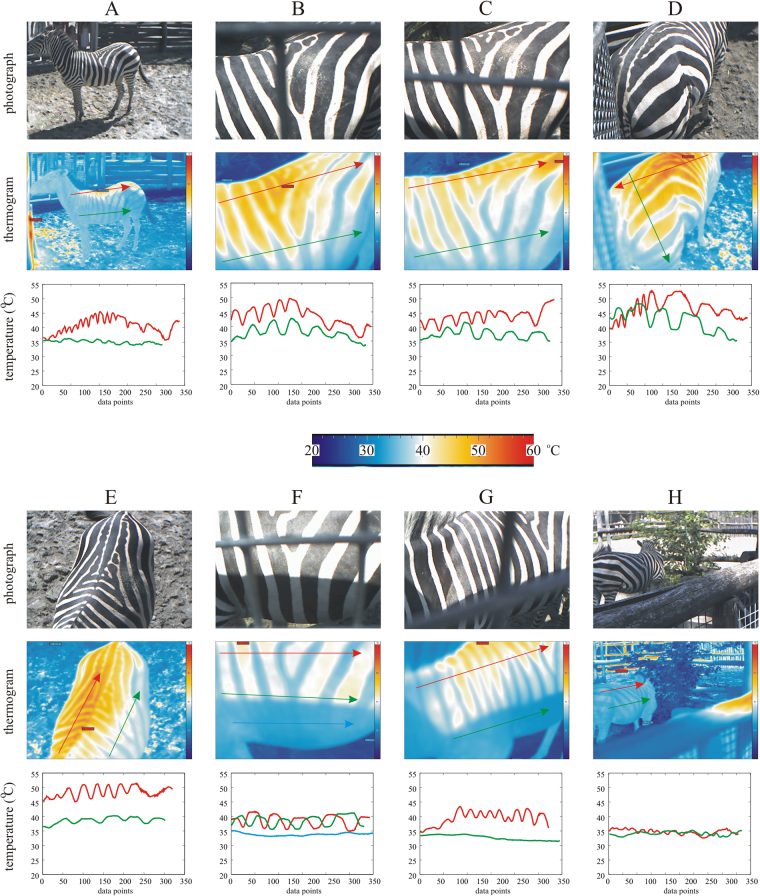
Figure 5.
Thermography of zebras. Photographs (taken by Gábor Horváth) and thermograms of sunlit (A–G) and shady (H) zebras (Equus burchelli boehmi) in the Budapest Zoo & Botanical Garden, and the change of surface temperature T (°C) along straight lines marked with arrows in the thermograms. The upper (red) and lower (green) arrow runs on a sunlit and shady region of the zebra body, respectively. The beginning and the end (head) of the arrows correspond to the first and last data points of the T-curves. In the thermograms red, yellow, white, light blue and dark blue colour hues code hot, warm, medium, cool and cold temperatures, respectively. There are some small differences between the photograph and the thermogram of a given scene because of the slightly different fields of view of the optocamera and the thermocamera. Since the optocamera was immediately below the thermocamera, in scenes (B,C,F and G) the optocamera saw the (horizontal, vertical) metal rods of the fence, while these rods were out of the field of view of the thermocamera.

