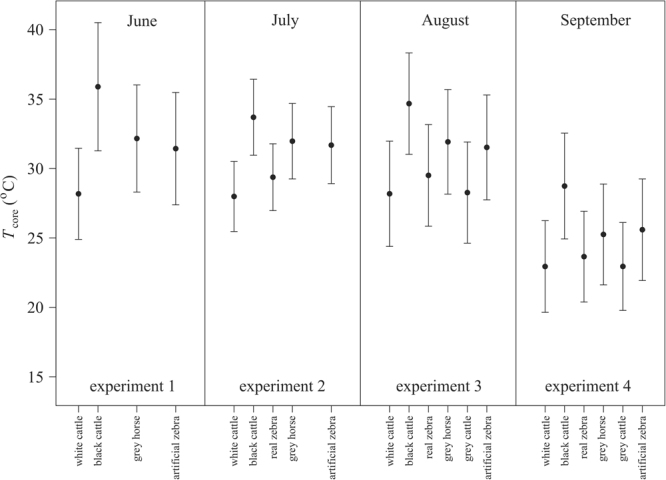
Figure 6.

Core temperature of barrels on hot days. Average (dots) ± standard deviation (vertical bars) of the barrels’ core temperature Tcore calculated only for hot days when the average air temperature was higher than 25 °C (above which cooling air eddies over zebras were the most likely to form) between 12:00 and 18:00 h (UTC + 2 h) in June (experiment 1), July (experiment 2) and August (experiment 3), and between 12:00 and 17:00 h in September (experiment 4).
