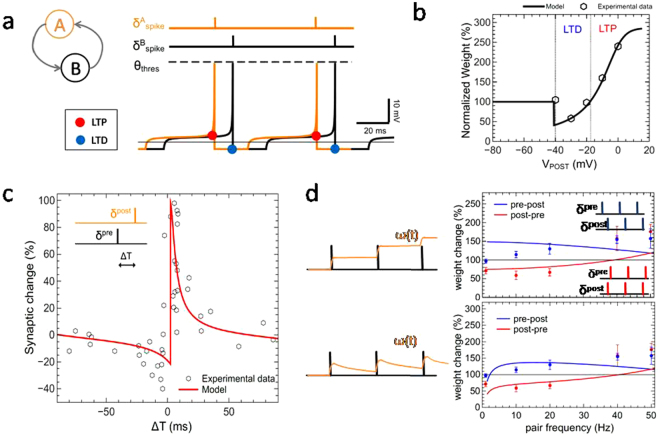
Figure 3.
Illustration of the present memristive neural plasticity model in comparison to synaptic plasticity data from neurophysiologic experiments: (a) Schematic of the given model: LTP occurs whenever one of the neurons (A or B) is spiking (whichever reaches the threshold voltage ϴthres) and the membrane potential u(t) of the opposite neuron is positive (above the black solid line in a). LTD is introduced if at the spike time the opposite neuron has a negative u(t). Thus, the role of pre and post neuron can change so that a bi-directional coupling between the neurons can be obtained. (b) Pre-synaptic stimulation under voltage clamp condition with 25 spike repetitions. Experimental data are taken from ref.28 shown as dots. (c) Spike-timing-dependent plasticity is compared to experimental data from ref.2. (d) Frequency dependency of spike pairs for pre-post (blue lines) and post-pre (red lines) pairing. While in the upper graph the synaptic weight is held constant between spike events, a weight dependent depression was applied to obtain the data shown in the lower graph. Solid lines are model data, while dots are experimental data taken from ref.4. The used simulation parameters are listed in Table 1. The parameters have been adjusted in such a way that the same set of parameters can be used for all illustrated plasticity emulations.

