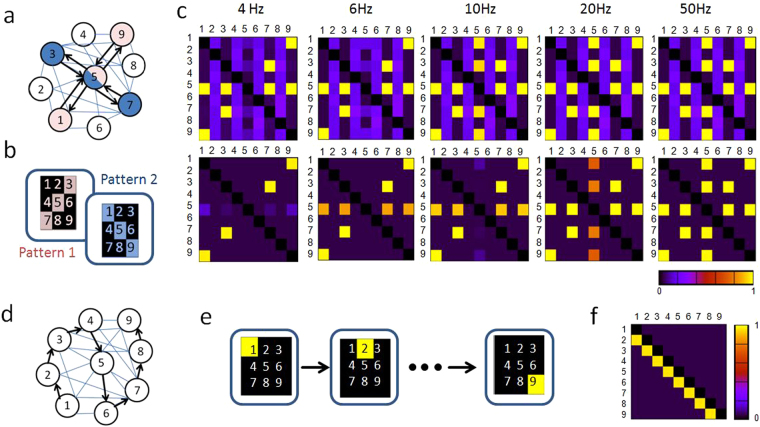
Figure 4.
Connectivity pattern in all-to-all connecting networks: (a) Schematic of the network topology in which the neurons (1–9) mutually coupled to each other. The colored neurons represent the two applied pattern 1 and 2, shown in (b). (c) Obtained connectivity patterns (adjacency matrices show the strength of the connection of two neurons each, with rows denoting the jth and columns the ith neurons) for five different spiking frequencies by using rate coding. For the different frequencies the input current to the spiking neurons has been varied. In the upper row the synaptic weight is held constant between spike events, while a weight dependent depression is used in for the simulations shown in the lower row. (d) Schematic of the network topology for temporal coding: the black arrows highlighted the connectivity pattern, which are expected to appear for a temporal coding. (e) All nine pixels of the input pattern are given successively every 17 ms to the network at a frequency of 60 Hz. (f) The weight matrix (adjacency matrix as explained in caption of Fig. 1 (c)) under temporal coding shows the eight unidirectional connections which has been formed in respect to order of showed pixels. For the simulation a constant leakage rate for the single connections has been used. Simulation parameters are given in Table 1, while further technical details of the simulation can be found in the appendix.

