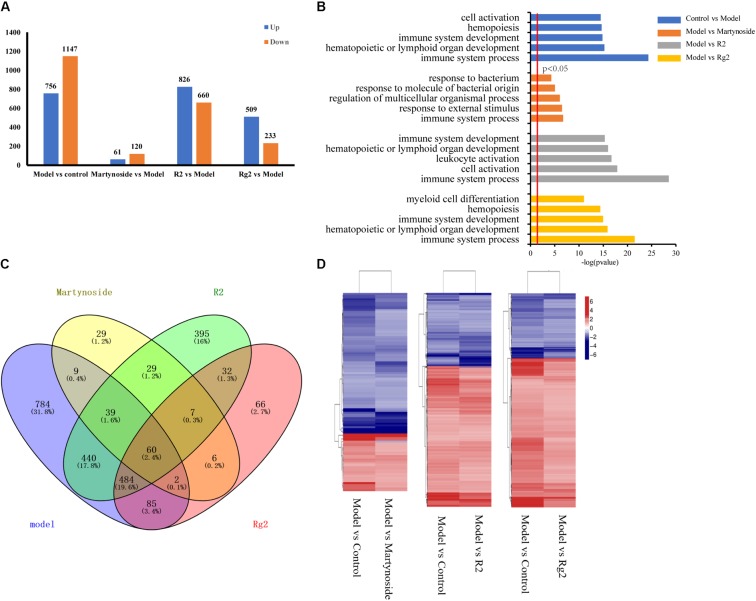
FIGURE 4.
Gene expression profiling by RNA-seq. (A) Number of upregulated and downregulated genes in Model and each treatment group. (B) List of enriched GO term Biological Process for Model and each treatment group. (C) Venn diagram of DEGs between Control vs. Model (model), Martynoside vs. Model (Martynoside), R2 vs. Model (R2), and Rg2 vs. Model (Rg2). (D) Heat map of common DEGs.

