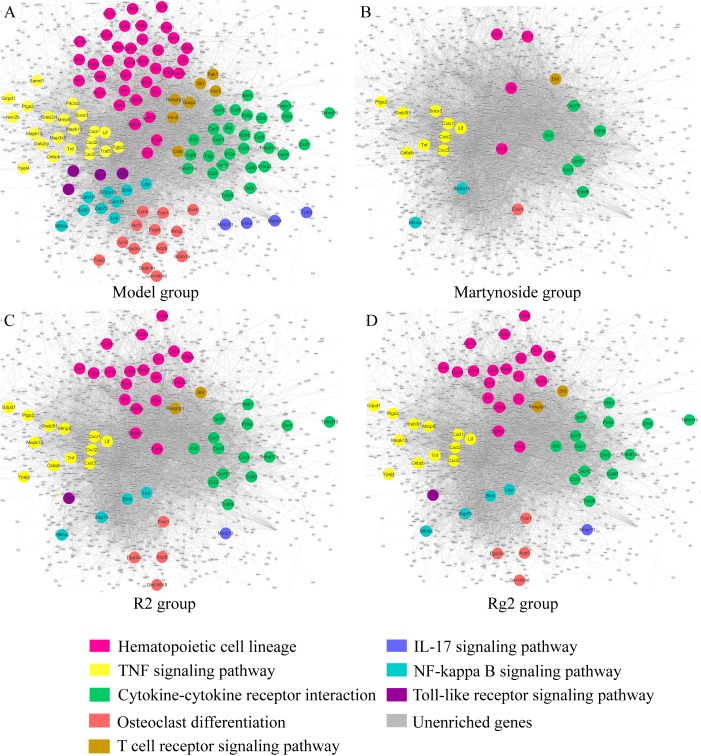
FIGURE 7.
Hematopoiesis-related molecular regulatory networks for martynoside, R2, or Rg2. (A) Model group. (B) Martynoside group. (C) R2 group. (D) Rg2 group. The nodes are representative of DEG altered in the myelosuppression mouse model. The lines are representative of interactions between DEG. The color of node indicates enrichment in different pathways; gray nodes indicate genes that were not enriched in that treatment group.

