Figure 4.
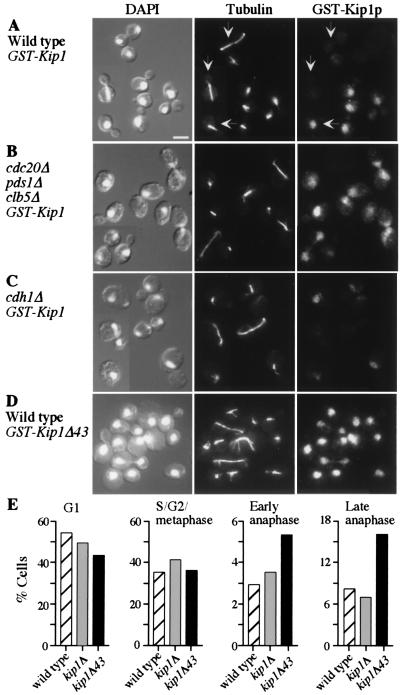
The timing of Kip1p degradation and the effect of the kip1Δ43 mutation. (A) Abundance of the GST-Kip1 (766–1111) fusion protein in a wild-type strain. The first panel shows DAPI staining that has been superimposed on differential interference contrast microscopy images, the second panel shows anti-tubulin staining, and the third panel shows anti-GST staining. GST-Kip1p is confined to the nucleus, and the faint anti-GST staining present throughout the cells is nonspecific and also was present in strains without a GST-fusion protein. The vertical arrows indicate mid- and late-anaphase cells in which Kip1p has been degraded, and the horizontal arrow indicates a metaphase cell in which Kip1p is abundant. (Bar = 4 μm.) (B) Abundance of the GST-Kip1 (766–1111) fusion protein in a cdc20-deletion mutant. Mid- and late-anaphase cells in which GST-Kip1p has not been degraded are shown. (C) Abundance of GST-Kip1p in a cdh1-deletion mutant. Like in wild type, GST-Kip1p is degraded in anaphase. (D) Abundance of GST-Kip1Δ43p in a wild-type strain. GST-Kip1Δ43p is present in all cells. (E) Cell-type distribution in wild-type, kip1Δ, and kip1Δ43 strains. Proliferating cultures were grown at 30°C and fixed for microscopy. Cells were placed into one of four stages of the cell cycle based on bud morphology, mitotic spindle length, and nuclear DNA localization. For each strain, at least 840 cells from duplicate cultures were scored.

