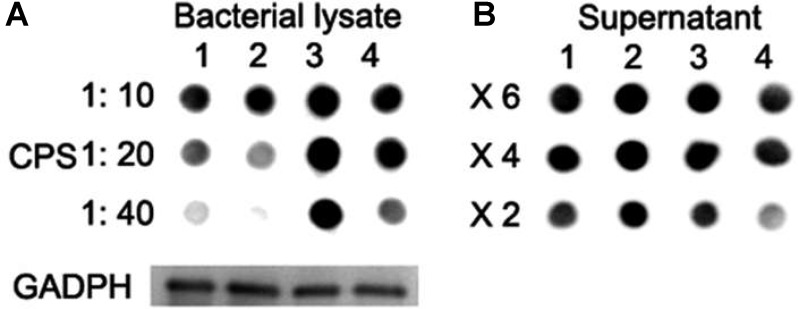
FIGURE 5.
CPS quantification with Dot blot assays. (A) Lane 1: wild-type D39; lane 2: ΔlytR mutant; lane 3: complemented strain; lane 4: ΔlytR mutant grown in C+Y medium plus 500 ng LytR protein. 1:10, 1:20 and 1:40 indicate the diluted fold of samples. (B) X6, X4 and X2 indicate the concentration fold of the culture medium. GADPH was used as loading control. Three independent experiments were performed and representative figures were presented.

