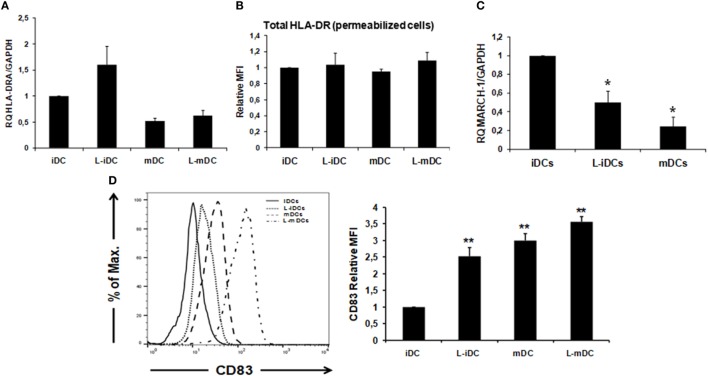
Figure 3.
HLA-DR cell surface expression correlates with an increase in CD83 expression and a downregulation of MARCH-1. (A) Relative quantification of HLA-DRA gene transcription in control and L-DCs. Data (mean ± SDs) from three independent experiments are shown. (B) Total HLA-DR protein (extra +intracellular) levels were assessed by flow cytometry in lenalidomide-treated and untreated DCs. Data from three independent experiments are shown as the relative mean of fluorescence intensity (MFI) ± SDs from permeabilized cells (*p < 0.05; **p < 0.03). (C) MARCH-1 mRNA is downregulated in L-DCs. Q-PCR data from four independent experiments are shown as mean gene expression levels relative to the expression of GAPDH (*p < 0.05; **p < 0.03). (D) CD83 surface expression is upregulated in DCs differentiated in the presence of lenalidomide, as measured by flow cytometry. Left: the histogram shows a representative experiment. Right: relative MFI ± SDs from six independent experiments.

