Figure 4.
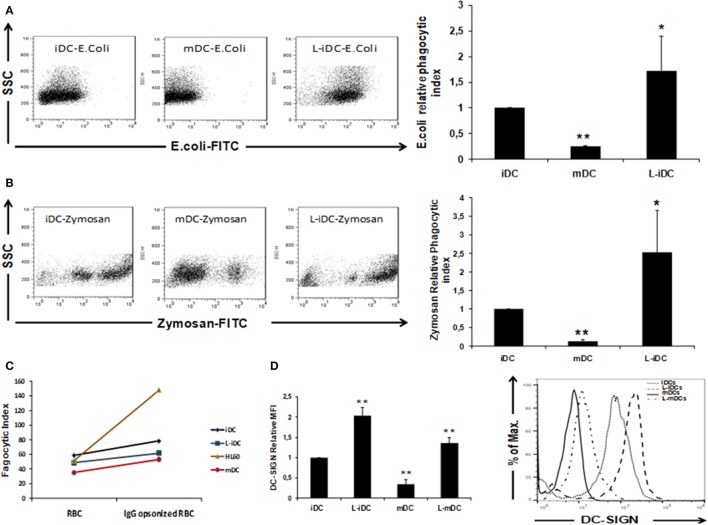
Phagocytosis of Escherichia coli and Zymosan is enhanced in L-iDCs. (A) Non-opsonized FITC-labeled E. coli was phagocytized more efficiently by L-iDCs than control DCs. The number of dendritic cells (DCs) showing green fluorescence was determined by flow cytometry. Left panel shows a Dot Plot with SSC vs FITC fluorescence from a representative experiment. Right panel shows the phagocytic index average of five independent experiments. Phagocytic index was calculated as (% positive cells × mean channel fluorescence). (B) Non-opsonized FITC-labeled Zymosan was phagocytized more efficiently by L-iDCs than control DCs. The number of DCs showing green fluorescence was determined by flow cytometry. Left panel shows a Dot Plot with SSC vs FITC fluorescence from a single experiment. Right panel shows the phagocytic index average of five independent experiments. (C) Green-labeled sheep red blood cells previously opsonized with human AB + serum were used to perform phagocytosis assays. HL60 cells were used as a control for opsonization-dependent phagocytosis. The number of DCs showing green fluorescence was determined by flow cytometry. The average of two independent experiments is shown. (D) DC-SIGN expression is upregulated on the surface of DCs differentiated in the presence of lenalidomide. Left panel shows the relative mean fluorescence intensity (MFI) ± SDs of three independent experiments. Right panel shows a representative histogram of a DC-SIGN staining (*p < 0.05; **p < 0.03).

