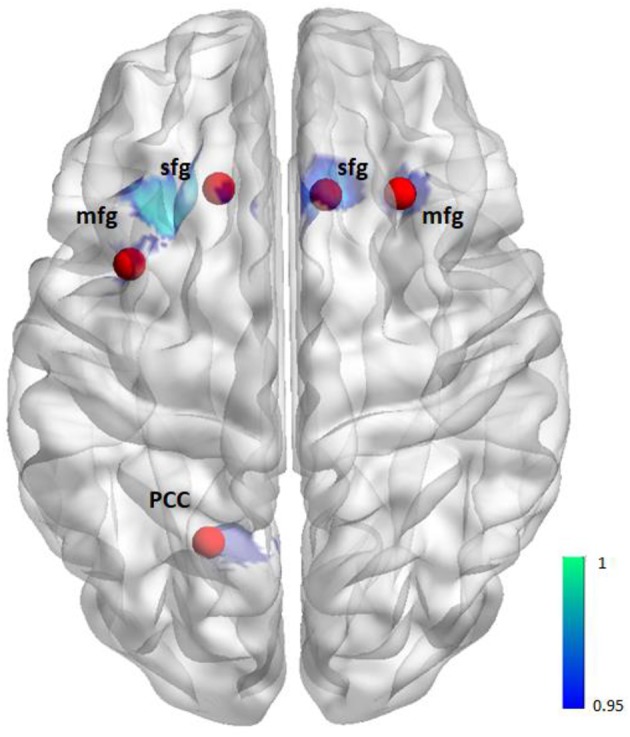
Figure 1.

Illustration of seeds for the seed-to-voxel functional connectivity analysis. Seeds (red) are based on the activation (blue) from the group comparison (i.e., 6 mm sphere centered on the maximum activated voxel for the contrast controls > patients positive feedback/reward, see also Table 2).
