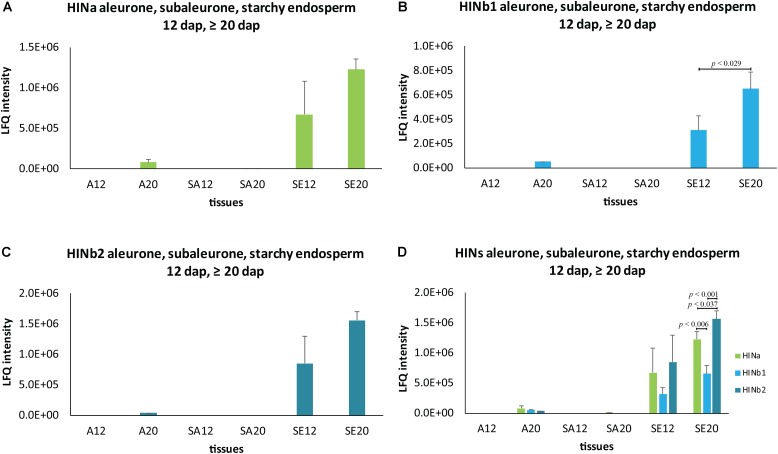
FIGURE 5.
Spatio-temporal HIN protein LFQ quantification in developing barley endosperm. Protein quantification of (A) HINa, (B) HINb1, and (C) HINb2 in aleurone (A), subaleurone (SA), and in starchy endosperm (SE) at 12 and ≥20 dap. (D) Overview of HIN proteins in A, SA, and SE at 12 and ≥20 dap. For statistical analyses, we performed a Student’s t-test. LFQ intensities of proteins were averaged over three biological replicates. Bars represent standard deviation. Note the indicated p-values.

