
FIGURE 8.
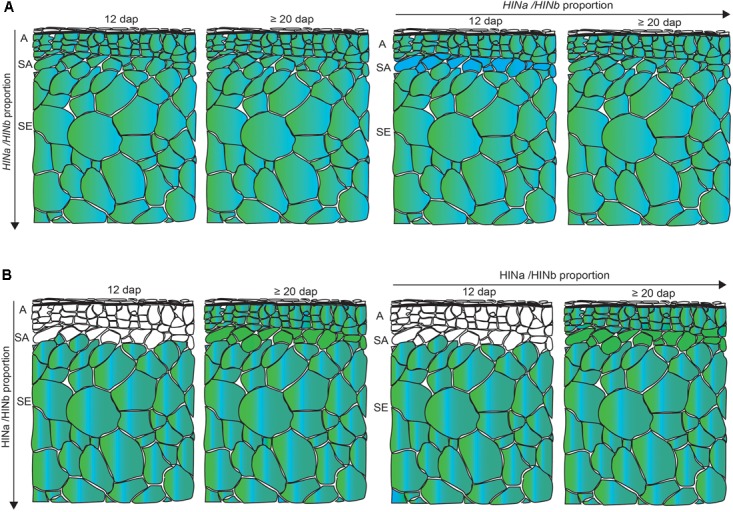
Schematic overview of the spatio-temporal HIN transcript and HIN protein abundance in developing barley endosperm. (A) HINa/HINb transcripts proportion in all tissues between 12 and ≥20 dap and between aleurone (A), subaleurone (SA), and starchy endosperm (SE) between 12 and ≥20 dap. (B) HINa/HINb protein abundance proportion in all tissues between 12 and ≥20 dap and between A, SA, and SE between 12 and ≥20 dap. Color code: green, HINa; bright blue, HINb1; and turquoise, HINb2. White cells represent no detected HIN proteins. Note the differences in the SA layer. Figure was drawn by the software program Adobe Illustrator CC 2015.