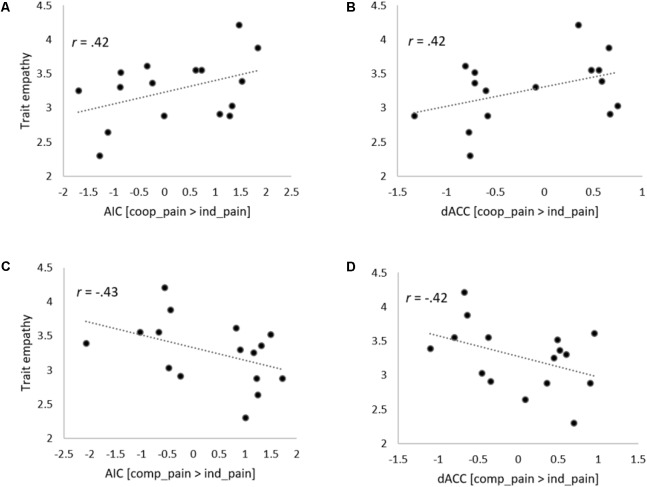
FIGURE 7.
Scatter plots describing correlations between individual’s trait empathy score and state empathic neural responses. Correlations between trait empathy and signal changes in the AIC (A) and dACC (B) activations in (Cooperation_Pain > Individual_Pain) contrast. Correlations between trait empathy and signal changes in the AIC (C) and dACC (D) activations in (Competition_Pain > Individual_Pain) contrast.

