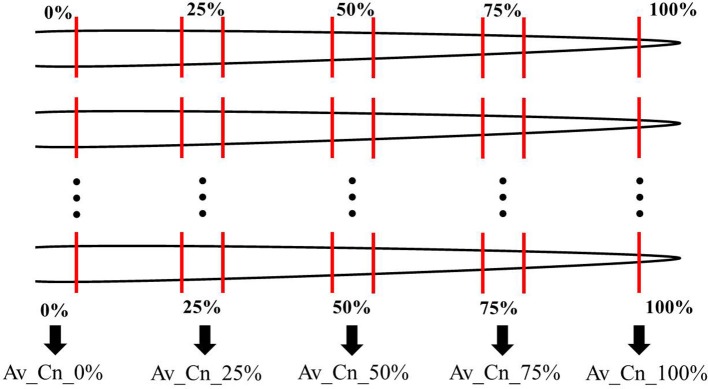
Figure 1.
Root sampling scheme for all experiments. From every root, five root segments of 1 cm length were taken at the root basis (0%), the root tip (100%), the middle of the root (50%) and further two in between (25 and 75%). The FTIR-ATR spectra of the corresponding root position of one cultivar or provenience was used to calculate an arithmetic average (Av) which are labeled “Av_Cn_0%” in the figures. In the text, the abbreviation “Av-spectra” is used. Cn means cultivar number. See Table 2 for the number of roots used for the averages.

